< List of probability distributions < Survival distribution
What is a survival distribution?
A survival distribution is the probability distribution of a survival function; a function which tells us how long before a process terminates, fails, or comes to an expected end. It’s a tool that can help us predict how long something will last.
Survival distributions are used in a variety of fields to help make predictions about how long something will last. For example:
- Physics: to predict the lifespan of materials or products.
- Medicine: to predict patient survival times from time of diagnosis to death.
- Engineering: to determine the reliability of systems or components.
- Finance: to model the time until defaults on loans or bonds.
- Biology: to predict the lifespan of organisms or animals.
The survival and hazard functions
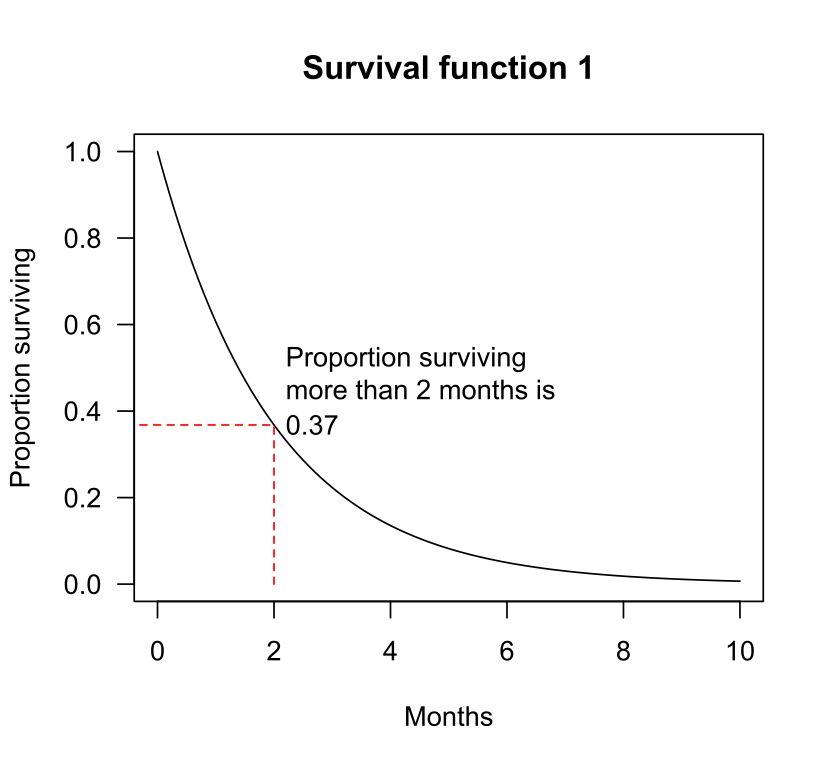
The survival function (S) is a special case of the survival distribution where the time is measured from a certain starting point. It is defined as [2]
S(t) = 1 − F(t) = P(T > t) for t > 0.
The function represents the probability that the event in question hasn’t occurred by a specific time, t. So, if T symbolizes the time until a death, S(t) stands for the probability of surviving past time t.
The equation results in results that are right continuous in t. This means that the function is non-decreasing and — for any point x, –the limit of the function as x approaches from the right is equal to the function value F(x). In practical terms, it could give us the probability that a person hasn’t died by a certain age. The function would be non-decreasing because the probability that a person hasn’t died can’t decrease over time (unless you’re a vampire!).
The hazard function is the derivative of the survival function and is defined as
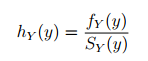
This is a conditional density, meaning that the event in question hasn’t happened yet. For example, it could give the probability a person will default on a loan in the next year, given that they haven’t defaulted yet.
Survival distribution examples
Types of survival distributions that are commonly used include:
- The exponential distribution is often used to model the time until failure of a system or component.
- The Weibull distribution is also used to model product lifetimes.
- The log-normal distribution is also sometimes used for modeling survival times.
As an example, the exponential distribution can be defined as follows: If we denote h(t) as the hazard function, and S(T) as the survival function, where the hazard function remains constant over time:
- h(t)= λ
- S(T)= e-λt
The survival distribution is the product of these two, so
f(t)= λ e-λt for λ > 0.
An important characteristic of the exponential survival distribution is its ‘memoryless property.’ If a probability distribution has this property, the probability of an event occurring in the future is independent of whether it has occurred in the past. In other words, how the function behaved in the past bears no relevance to its future behavior. This characteristic is seen in certain hardware failures and makes the exponential survival distribution useful for predicting component failures.
Defining “The End” in a survival distribution
In order for survival distributions to be useful, the “end” must be clearly specified as a distinct, specific scenario.
For example, if your failure shows a gradual decline rather than an abrupt stop, you’ll need to determine at what stage of the decline it becomes significant. Could failure be defined as a drop to 35% functionality? Or perhaps 25%? 10%? 0.001%? The choice is yours, but ensure you make this decision prior to starting calculations.
At times, it may be unfeasible to pinpoint an exact end, and assigning one arbitrarily could render your research meaningless. In such situations, you might need to resort to recurring event or repeated event models such as the Poisson process or gamma process.
Recurring event models are designed to model data where the events of interest happen multiple times over a time period. For instance, such a model could model data on the frequency of machine breakdowns or the recurrence of a patient’s disease post-treatment. These models are typically applied when it’s impractical to establish a single, definitive end point for analysis. For instance, if we’re studying machine breakdowns, we can’t merely set the end point as the first breakdown, as the machine may malfunction several times during the study.
References
- Michaelg2015, CC BY-SA 4.0, via Wikimedia Commons
- BIO 244: Unit 1 Survival Distributions, Hazard Functions, Cumulative Hazards. Retrieved June 30, 2023 from: https://web.stanford.edu/~lutian/coursepdf/unit1.pdf