Contents (click to go to the section):
- Sample Mean Definition and Symbol
- How to Find the Sample Mean
- Variance of the sampling distribution of the sample mean
- Calculate Standard Error for the Sample Mean
- Uses for Sample Means
Watch the video for an example of how to find the sample mean:
Sample Mean Definition and Symbol
The sample mean symbol is x̄, pronounced “x bar”. The sample mean is an average value found in a sample. 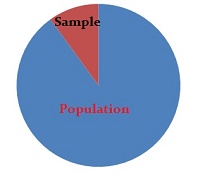 In statistics, the sample mean is an average of a set of data — data that is sampled from a larger population. This measure of central tendency can be used to calculate the standard deviation and sample variance of a data set. The sample mean can also be applied to determine population averages.
The main difference between a sample mean and a “regular” mean is that the data is calculated from a sample. A sample represents a small portion of a larger whole. For instance, if you work for a polling company and want to determine how much individuals spend on food annually, it would be impractical to survey every person in the United States. Instead, you can select a smaller fraction of that population (perhaps 250 people) to represent the sample. The term “mean” is another name for the average. In this case, the sample mean would be the average amount that these 250 people spend on food each year.
The sample mean is valuable because it enables estimation of the broader population’s behavior without having to survey everyone. If, for example, the sample mean for annual food spending was $6000, it is likely that a very similar figure would be obtained if every person in the population were surveyed. Thus, the sample mean serves as a time and cost-effective method for approximating population trends.
Formula
The sample mean formula is:
x̄ = ( Σ xi ) / n
Remember the formula to find an “average” in basic math? It’s the exact same thing, only the notation (i.e. the symbols) are just different. Let’s break it down into parts:
- x̄ = the “sample mean”
- Σ = summation notation, which means “add up”
- xi = “all of the x-values”
- n = “the number of items in the sample”
Plug in the numbers that you’re given and solve using arithmetic (there’s no algebra required—you can plug this in to any calculator). You might see the following alternate sample mean formula:
x̄ = 1/ n * ( Σ xi )
The set up is slightly different, but algebraically it’s the same formula (if you simplify the formula 1/n * X, you get 1/X). Back to Top
How to Find the Sample Mean
Finding the sample mean is no different from finding the average of a set of numbers. In statistics you’ll come across slightly different notation than you’re probably used to, but the math is exactly the same. The formula to find the sample mean is:
x̄ = ( Σ xi ) / n
All that formula is saying is add up all of the numbers in your data set ( Σ means “add up” and xi means “all the numbers in the data set). This article tells you how to find the sample mean by hand (this is also one of the AP Statistics formulas). However, if you’re finding the sample mean, you’re probably going to be finding other descriptive statistics, like the sample variance or the interquartile range so you may want to consider finding the sample mean in Excel or other technology.
Why? Although the calculation for the mean is fairly simple, if you use Excel then you only have to enter the numbers once. After that, you can use the numbers to find any statistic: not just the sample mean.
How to Find the Sample Mean: Steps
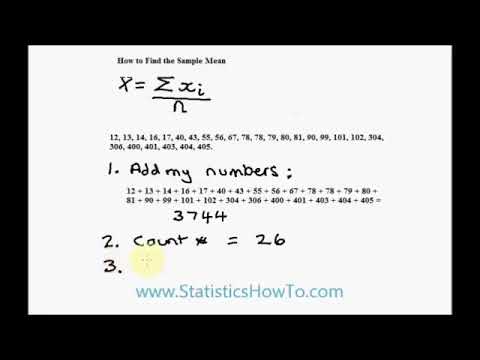
Example Question: Find the sample mean for the following set of numbers: 12, 13, 14, 16, 17, 40, 43, 55, 56, 67, 78, 78, 79, 80, 81, 90, 99, 101, 102, 304, 306, 400, 401, 403, 404, 405.
- Add up all of the numbers: 12 + 13 + 14 + 16 + 17 + 40 + 43 + 55 + 56 + 67 + 78 + 78 + 79 + 80 + 81 + 90 + 99 + 101 + 102 + 304 + 306 + 400 + 401 + 403 + 404 + 405 = 3744.
- Count the numbers of items in your data set. In this particular data set there are 26 items.
- Divide the number you found in Step 1 by the number you found in Step 2. 3744/26 = 144.
That’s it! Tip: If you have to show working out on a test, just place the two numbers into the formula. Step 1 gives you the σ and Step 2 gives you n:
- x = ( Σ xi ) / n
- = 3744/26
- = 144
Variance of the Sampling Distribution of the Sample Mean
This section covers the variance of the sampling distribution of the mean. If you aren’t familiar with the central limit theorem, you may want to read the previous article: The Mean of the Sampling Distribution of the Mean. Watch the video or read on below:
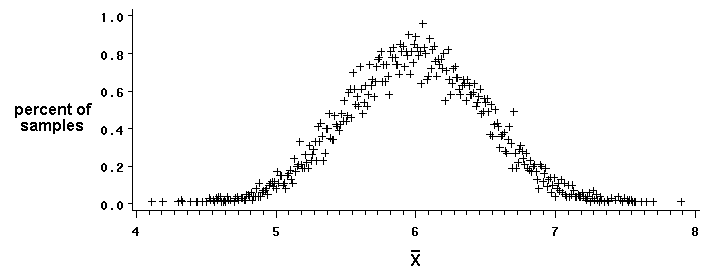
The sampling distribution of the sample mean is a probability distribution of all the sample means. Let’s say you had 1,000 people, and you sampled 5 people at a time and calculated their average height. If you kept on taking samples (i.e. you repeated the sampling a thousand times), eventually the mean of all of your sample means will:
- Equal the population mean, μ
- Look like a normal distribution curve.
The variance of this probability distribution gives you an idea of how spread out your data is around the mean. The larger the sample size, the more closely the sample mean will represent the population mean. In other words, as N grows larger, the variance becomes smaller.
Ideally, when the sample mean matches the population mean, the variance will equal zero. The formula to find the variance of the sampling distribution of the mean is:
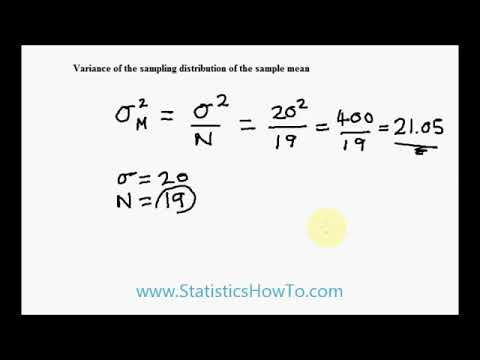
σ2M = σ2 / N,
where:
- σ2M = variance of the sampling distribution of the sample mean.
- σ2 = population variance.
- N = sample size.
Example question: If a random sample of size 19 is drawn from a population distribution with standard deviation α = 20 then what will be the variance of the sampling distribution of the sample mean?
- Figure out the population variance. Variance is the standard deviation squared, so: σ2 = 202 = 400.
- Divide the variance by the number of items in the sample. This sample has 19 items, so: 400 / 19 = 21.05.
That’s it! Back to Top
Calculate Standard Error for the Sample Mean
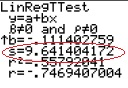
Standard error for the sample mean, “s” on a TI-calculator.
The standard error of the mean of a sample is equal to the standard deviation for the sample. The difference between standard error and standard deviation is that with standard deviations you use population data (i.e. parameters) and with standard errors you use data from your sample. You can calculate standard error for the sample mean using the formula:
SE = s / √(n)
SE = standard error, s = the standard deviation for your sample and n is the number of items in your sample.
Calculate Standard Error for the Sample Mean: Steps
Example: Find the standard error for the following heights (in cm): Jim (170.5), John (161), Jack (160), Freda (170), Tai (150.5).
- Find the mean (the average) of the data set: (170.5 + 161 + 160 + 170 + 150.5) / 5 = 162.4.
- Calculate the deviation from the mean by subtracting each value from the mean you found in Step 1. 170.5 – 162.4 = -8.1 161 – 162.4 = 1.4 160 – 162.4 = 2.4 170 – 162.4 = -7.6 150.5 – 162.4 = 11.9
- Square the numbers you calculated in Step 2: -8.1 * -8.1 = 65.61 1.4 * 1.4 = 1.96 2.4 * 2.4 = 5.76 -7.6 * -7.6 = 57.76 11.9 * 11.9 = 141.61
- Add the values you calculated in Step 3: 65.61 + 1.96 + 5.76 + 57.76 + 141.61 = 272.7
- Divide the number you found in Step 4 by your sample size – 1. There are five items in the sample, so n-1 = 4: 272.7 / 4 = 68.175.
- Take the square root of the number you found in Step 5. This is your standard deviation. √(68.175) = 8.257
- Divide the number you calculated in Step 6 by the square root of the sample size (in this sample problem, the sample size is 5): 8.257 / √(5) = 8.257 / 2.236 = 3.693
That’s how to calculate the standard error for the sample mean!
Tip: If you’re asked to find the “standard error” for a sample, in most cases you’re finding the sample error for the mean using the formula SE = s/√n. There are different types of standard error though (i.e. for proportions), so you may want to make sure you’re calculating the right statistic.
Uses for Sample Means
There are many different uses for a sample mean. As mentioned before, this measure can be used to calculate central tendency, standard deviation and variance. Additionally, the sample mean can be used to predict future events or trends. For instance, the sample mean can be used for both scientific discovery as well as predicting future outcomes.
- Education: Educational institutions apply the sample mean to estimate the average test score for a specific grade level. This information helps identify high-performing schools and allocate resources to those that require assistance.
- Finance: Banks use the sample mean to estimate the average credit score for specific loan types. This information guides lending decisions and evaluates the risk of default.
- Healthcare: Hospitals leverage the sample mean to determine the average length of stay for particular surgeries. This data enhances hospital efficiency and ensures patients receive proper care.
- Insurance: Insurance companies utilize the sample mean to estimate the average cost of claims for specific insurance types. This data helps establish premiums that balance fairness for both the insurer and the policyholder.
- Manufacturing: Manufacturers employ the sample mean to gauge the average quality of a product. This information aids in identifying potential issues within the manufacturing process and ensuring the product meets customer expectations.
- Retail: Retailers use the sample mean to approximate the average price of products. This data helps set competitive prices while ensuring profitability for the retailer.
Another common use for the sample mean is calculating population averages. Imagine you are trying to determine how much money the average person spends on groceries per month. You could survey 100 people and ask them how much they spend on groceries in a typical month. Then you would take all 100 responses and calculate the sample mean. This would give you an estimate of how much money the average person spends on groceries each month. However, it’s important to keep in mind that this number is only an estimate since you did not surveyed every single person in existence!