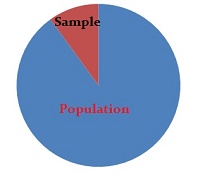
A sample statistic is a piece of statistical information you get from a handful of items.
- A sample is just a part of a population. For example, let’s say your population was every American, and you wanted to find out how much the average person earns. Time and finances stop you from knocking on every door in America, so you choose to ask 1,000 random people. This one thousand people is your sample.
- One you have your sample, you’ll get some kind of statistic. A statistic is really just a piece of information—in this example, average earnings.
When your statistical information (like an average, median, or some other kind of statistic) comes from a fraction of data or part of a population, it’s called a sample statistic.
Sample Statistic Usage
When we talk about a “sample statistic”, that’s a very vague definition that really has no meaning without some specific information attached to it. For example, if you tell someone what your average is 11, they would want to know what that figure pertains to: 11 cakes baked in a week, 11 letters a day, or 11 baskets weaved in a year?
Cautions
As you’re only working with a small part of a population, your sample statistic can vary wildly, depending on which items you choose from the population. In fact, most sample statistics come with a degree of uncertainty. It’s very improbably that the information you glean from a few items will paint a true picture or give you an exact answer for what’s going on in the population as a whole. Statistics is really scientific guesswork, but we can quantify uncertainty with margins of error, confidence intervals, and many other statistical tools.
References
Jackson, S. (2016). Statistics Plain and Simple. Cengage Learning.