What is Bessel’s Correction?
Bessels’ correction refers to the “n-1” found in several formulas, including the sample variance and sample standard deviation formulas. This correction is made to correct for the fact that these sample statistics tend to underestimate the actual parameters found in the population.
Bessel’s is also found in calculations for the Student’s T Test.
Bessel’s Correction in Variance and Standard Deviation Calculations
You’ll usually use the following formula to find the sample variance:

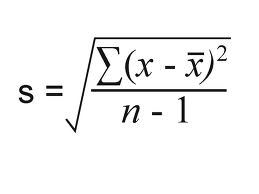
The formula for the sample standard deviation is similar:

As you can see, both formulas have n-1 in the denominator, where n is the sample size.
So why do we subtract 1 when using these formulas?
The simple answer: the calculations for both the sample standard deviation and the sample variance both contain a little bias (that’s the statistics way of saying “error”). Bessel’s correction (i.e. subtracting 1 from your sample size) corrects this bias. In other words, you’ll usually get a more accurate answer if you use n-1 instead of n.
The more technical answer:
When you have an entire population and calculate any parameter (like the population variance or population standard deviation), your results will be accurate. That’s because you have all the data about your population. However, when you work with a sample, you’ve only got a small fraction of the population to work with. Therefore, your answers aren’t going to be as accurate as those you would have got, if you had the entire set of data to work with.
In the case of the sample variance & standard deviation, the particular statistic you are working with is the sample mean (x̄) instead of the population mean (μ). Any x-value in your sample is going to be closer to x̄ than to μ.
This fact alters the sums of squares (in the numerator of the above formulas). The sum of squares for μ
![]()
is going to be larger than the sum of squares for x̄.
![]()
In other words, sample calculations with n in the denominator are almost always going to be higher than calculations with n-1 in the denominator (Warne, 2017). When you subtract 1 from your sample size, it happens to turn out you’re making a fairly good adjustment for the deflated sum of squares figure as long as n isn’t huge (Edelman, 2018).
When Should I Use Bessel’s Correction?
For small sample sizes, Bessel’s correction is going to be quite severe. If you have a small sample, it’s highly unlikely that it’s going to be a very good estimate of the population mean anyway. If you have a very large sample size, you’re going to approach a point when your sample statistics are going to be almost equal to your population parameters. In that case, Bessel’s correction simply isn’t needed at all.
Warne (2017) advocates using Bessel’s correction only if you have a sufficiently large sample and if you are actually trying to approximate the population mean. If you’re just interested in finding the sample mean, and don’t want to extrapolate your findings to the population, just omit the correction.
References
Edelman, A. (2018). Retrieved July 25, 2017 from: http://web.mit.edu/18.06/www/Spring17/Statistics-and-PCA.pdf
LaValle, S. (2016). Testing the Hypothesis. Retrieved July 25, 2017 from: http://vr.cs.uiuc.edu/node423.html
Warne, T. (2017). Statistics for the Social Sciences: A General Linear Model Approach. Cambridge University press.