Probability Distributions > Mixture Distribution
What is a Mixture Distribution?
A mixture distribution is a distribution with two or more combined probability distributions; A new distribution is created by drawing random variables from two or more parents. The parent distributions can be univariate distributions or multivariate distributions.
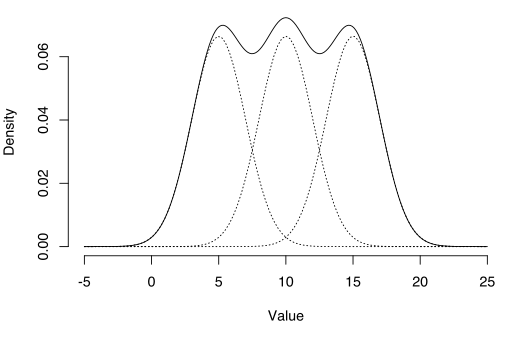
The distributions can be made up of different distributions (e.g. one normal distribution and one t-distribution) or they can be made up of the same distribution with different parameters. For example, the following image shows a mixture of three normal distributions (called a Gaussian Mixture Model), each with a different mean:
The mixture distributions should be made up of distributions with the same dimension. For example, a distribution with a dimension of 2 (e.g., two variables x, y) should only be combined with other distributions of dimensionality 2. In addition, the distributions should either be all discrete or all continuous.
These new distributions are treated as bona fide probability density functions and so can be used to find expected values, maximum likelihood estimators and other statistics.
More Formal Definitions
A random variable has a p1 chance of following a D1 distribution, a p2 chance of following a D2 distribution and a pn chance of following a Dn distribution, where “n” is the number of possible distributions. In the example above, we have two possible distributions, so:
- pbinomdal = .3
- Pnormal = .7
A mixture distribution can also be defined by the following formula: 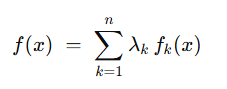 Where:
- The Birnbaum-Saunders distribution, used in fatigue life testing, is a mixture of an inverse Gaussian distribution and a reciprocal inverse Gaussian distribution [3].
- A chi-bar-squared distribution is a mixture of chi-square distributions, mixed over their degrees of freedom.
References
- Smason79|Wikimedia Commons. CC 4.0: https://creativecommons.org/licenses/by/3.0/deed.en
- MIT. Distribution Mixtures. Application Example 7. Online: https://ocw.mit.edu/courses/civil-and-environmental-engineering/1-151-probability-and-statistics-in-engineering-spring-2005/lecture-notes/app7_mixtures_fin.pdf
- Engineering Statistics Handbook. Fatigue Life (Birnbaum-Saunders). Online: https://www.itl.nist.gov/div898/handbook/apr/section1/apr166.htm
- f1, f2, … , fn are the component distributions,
- λk are the mixing weights. Mixing weights are the probabilities that each individual distribution contributes to the mixture distribution.
In addition:
- λk > 0,
- Σkλk = 1
Why Use a Mixture Distribution?
Two distributions that commonly represent the spread of test scores are the normal distribution and bimodal distribution. The random variable “test score” might have a .7 probability of following a normal distribution and .3 of following a bimodal distribution. You can combine these two distributions to analyze test overall scores.
The random variable described above has a p1 chance of following a D1 distribution, and a p2 chance of following a D2 distribution, so:
- Pbin = .3
- Pnormal = .7
For a second example, you might be thinking of investing in stock for a new Metaverse company. You think they are about to release a new lens, which will make the stock rise dramatically by a mean of 200% (standard deviation of 25%). However, there’s the possibility the lens has production issues, hindering a release. This would result in stock prices falling by an average of 30% with a standard deviation of 15%. As you don’t know if the gadget is going to be released or not, the mixture will be an equally weighted (i.e., 50% for the falling distribution and 50% for a rising distribution).
Example 3: In aeronautics, many factors affect flight, including barometric pressure, temperature, and wind speed. These quantities all have different distributions that vary with weather conditions and other factors like hurricane season. A mixture distribution allows for the analysis of multiple variables to model flight data [2].
Examples of Mixture Distributions
- The Birnbaum-Saunders distribution, used in fatigue life testing, is a mixture of an inverse Gaussian distribution and a reciprocal inverse Gaussian distribution [3].
- A chi-bar-squared distribution is a mixture of chi-square distributions, mixed over their degrees of freedom.
References
- Smason79|Wikimedia Commons. CC 4.0: https://creativecommons.org/licenses/by/3.0/deed.en
- MIT. Distribution Mixtures. Application Example 7. Online: https://ocw.mit.edu/courses/civil-and-environmental-engineering/1-151-probability-and-statistics-in-engineering-spring-2005/lecture-notes/app7_mixtures_fin.pdf
- Engineering Statistics Handbook. Fatigue Life (Birnbaum-Saunders). Online: https://www.itl.nist.gov/div898/handbook/apr/section1/apr166.htm