Statistics Definitions > Dimensionality
What is Dimensionality?
Dimensionality in statistics refers to how many attributes a dataset has. For example, healthcare data is notorious for having vast amounts of variables (e.g. blood pressure, weight, cholesterol level). In an ideal world, this data could be represented in a spreadsheet, with one column representing each dimension. In practice, this is difficult to do, in part because many variables are inter-related (like weight and blood pressure).
Note: Dimensionality means something slightly different in other areas of mathematics and science. For example, in physics, dimensionality can usually be expressed in terms of fundamental dimensions like mass, time, or length. In matrix algebra, two units of measure have the same dimensionality if both statements are true:
- A function exists that maps one variable onto another variable.
- The inverse of the function in (1) does the reverse.
High Dimensional Data
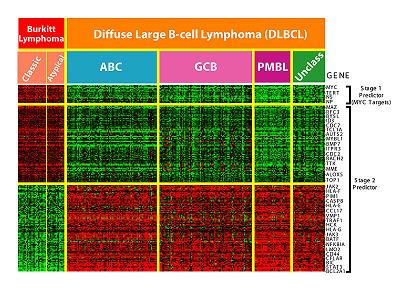
High Dimensional means that the number of dimensions are staggeringly high — so high that calculations become extremely difficult. With high dimensional data, the number of features can exceed the number of observations. For example, microarrays, which measure gene expression, can contain tens of hundreds of samples. Each sample can contain tens of thousands of genes.
One person (i.e. one observation) has millions of possible gene combinations. Other areas where features exceed observations include finance, high resolution imaging, and website analysis (e.g. advertising, crawling, or ranking).
What is Reduction of Dimensionality?
Reduction of dimensionality means to simplify understanding of data, either numerically or visually. Data integrity is maintained. To reduce dimensionality, you could combine related data into groups using a tool like multidimensional scaling to identify similarities in data. You could also use clustering to group items together.
Curse of Dimensionality
The curse of dimensionality usually refers to what happens when you add more and more variables to a multivariate model. The more dimensions you add to a data set, the more difficult it becomes to predict certain quantities. You would think that more is better. However, when it comes to adding variables, the opposite is true. Each added variable results in an exponential decrease in predictive power.
As a simple example, let’s say you are using a model to predict the location of a large bacteria in a 25cm2 petri dish. The model might be fairly accurate at pinning the particle down to the nearest square cm. However, let’s say you add just one more dimension: Instead of a 2D petri dish you use a 3D beaker . The predictive space increases exponentially, from 25 cm2 to 125 cm3. When you add more dimensions, it makes sense that the computational burden also increases. It wouldn’t be impossible to pinpoint where bacteria might be in a 3D model. However, it’s a more challenging task.
The statistical curse of dimensionality refers to a related fact: a required sample size n will grow exponentially with data that has d dimensions. In simple terms, adding more dimensions could mean that the sample size you need quickly become unmanageable.
Next: Unidimensionality
References and further reading:
Finney, D.J. (1977). “Dimensions of Stat” Journal of the Royal Stat. Society. Series C (Applied Stat). 26, No.3, p.285-289. RSS.