Statistics Definitions > Standardized Residuals
Standardized residuals are very similar to the kind of standardization you perform earlier on in statistics with z-scores. Z-scores allow you to standardize normal distributions so that you can compare your values; standardized residuals normalize your data in regression analysis and chi square hypothesis testing.
A standardized residual is a ratio: The difference between the observed count and the expected count and the standard deviation of the expected count in chi-square testing. The phrase “the ratio of the difference between the observed count and the expected count to the standard deviation of the expected count” sounds like a tongue twister, but it’s actually easier explained with an equation.
Standardized residual = (observed count – expected count) / √expected count
What do Standardized Residuals Mean?
The standardized residual is a measure of the strength of the difference between observed and expected values. It’s a measure of how significant your cells are to the chi-square value. When you compare the cells, the standardized residual makes it easy to see which cells are contributing the most to the value, and which are contributing the least. If your sample is large enough, the standardized residual can be roughly compared to a z-score. Standardization can work even if your variables are not normally distributed.
Rule of Thumb for Interpreting Standardized Residuals
A general rule of thumb for figuring out what the standardized residual means, is:
- If the residual is less than -2, the cell’s observed frequency is less than the expected frequency.
- Greater than 2 and the observed frequency is greater than the expected frequency.
If your residuals are +/-3, then it means that something extremely unusual is happening. If you get +/-4, it’s something from the Twilight Zone! This makes sense if you think about the 68 95 99.7 rule: if your data is normally distributed, 95% of your data should be within 2 standard deviations from the mean. If you have something greater than that, then you’re looking at an outlier.
Adjusted Residuals
Adjusted residuals are another way to do the same thing: compare your cell results. The formula for the adjusted residual is:
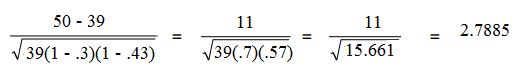
Adjusted residual = (observed – expected) / √[expected x (1 – row total proportion) x (1- column total proportion)]
Adjusted residuals are used in software (like the SDA software from the University of California at Berkeley). That particular software colors cells red is they have larger than expected counts and blue if they have lower than expected counts.
Let’s say you wanted to calculate adjusted residuals for cell A in the following table:
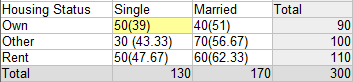
- Row Total Proportion for cell A is 39/90 = .43
- Column Total Proportion for cell A is 39/130 = .3
References
Everitt, B. S.; Skrondal, A. (2010), The Cambridge Dictionary of Statistics, Cambridge University Press.