Correlation Coefficients > Kendall’s Tau (Kendall Rank Correlation Coefficient) Contents:
- What is Kendall’s Tau?
- When to use Kendall’s Tau
- Types of Kendall’s Tau
- Example Problem
- Perfect Agreement
- Calculating Statistical Significance
What is Kendall’s Tau?
Kendall’s Tau is a non-parametric measure of relationships between columns of ranked data. The Tau correlation coefficient returns a value of 0 to 1, where:
- 0 is no relationship,
- 1 is a perfect relationship.
A quirk of this test is that it can also produce negative values (from -1 to 0). Unlike a linear graph, a negative relationship doesn’t mean much with ranked columns (other than you perhaps switched the columns around), so just remove the negative sign when you’re interpreting Tau. Several version’s of Tau exist.
- Tau-A and Tau-B are usually used for square tables (with equal columns and rows). Tau-B will adjust for tied ranks.
- Tau-C is usually used for rectangular tables. For square tables, Tau-B and Tau-C are essentially the same.
Most statistical packages have Tau-B built in, but you can use the following formula to calculate it by hand: Kendall’s Tau = (C – D / C + D) Where C is the number of concordant pairs and D is the number of discordant pairs.
When to use Kendall’s Tau
Three popular indices included in most statistical software packages are the Pearson product moment correlation, Spearman’s rank-order correlation and Kendall’s tau correlation. Nonparametric methods such as Kendall’s tau and Spearman’s rank-order correlation coefficients are recommended for non-normal data while the Pearson product moment correlation coefficient is commonly used for normally distributed data.
Several guidelines exist to determine when to use each of these correlation coefficients. One guideline is based on the type of data being analyzed. PPMC is suitable only for interval data, whereas Spearman’s and Kendall’s correlation coefficients can be used for either ordinal or interval data [1].
Other guidelines suggest which correlation coefficient is more appropriate for data involving different types of variables. Kendall’s tau is more suitable for data with at least one ordinal variable [2]. Other researchers have suggested using Spearman’s correlation coefficients in similar scenarios [3, 4, 5]. However, all of these correlation coefficients can also be computed for interval data (e.g., continuous data) [1].
Kendall [6] claims that for many practical purposes, tau is preferable partly because when estimating a correlation, the population parameter being estimated has a simpler interpretation. Kendall’s tau is less sensitive to outliers than Spearman’s Rho and is often preferred due to its simplicity and ease of interpretation.
Types of Kendall’s Tau
There are various versions of Kendall’s Tau available. Tau-A is the most basic form. It isn’t commonly used because Tau-B and Tau-C are easier to interpret and are more robust to tied ranks. Tau-B, which adjusts for tied ranks, is commonly used for square tables, where the number of columns and rows are equal. Tau-C is primarily used for rectangular tables. For square tables, Tau-B and Tau-C are essentially the same. Most statistical packages include Tau-B as a built-in feature, but you can also calculate it manually using the formula:
Kendall’s Tau = (C – D / C + D),
where C represents the number of concordant pairs and D represents the number of discordant pairs.
| Type | Description | Tied ranks adjustment? | Suitable for… |
|---|---|---|---|
| Tau-A | The basic version of Kendall’s tau. | No | Square tables |
| Tau-B | Adjusts for tied ranks by dividing the number of concordant pairs and discordant pairs by the total number of possible pairs. | Yes | Square tables |
| Tau-C | Adjusts for tied ranks by using a different tied ranks formula to accommodate rectangular tables. | Yes | Rectangular tables |
Kendall’s tau-C adjusts for tied ranks by using a different definition of concordant and discordant pairs. In the basic definition of concordant and discordant pairs used in Tau-A, two pairs are considered in agreement if they match in order, and in disagreement if they differ in order. However, this definition doesn’t consider the presence of tied ranks.
For instance, let’s consider the following two rankings of 3 items:
- Ranking 1: A B C
- Ranking 2: A C B
According to the original definition, these two rankings would be regarded as discordant because they differ in order. However, A and B are tied in both rankings with A B C in both ranking 1 and 2.
Tau-C takes into account the number of tied ranks by considering the number of concordant and discordant pairs that would occur if there were no tied ranks. In the example above, there would be 1 concordant pair and 0 discordant pairs if no ties were present. Therefore, Tau-C would consider these two rankings to be concordant.
The formula for Tau-C is as follows:
τc = (C – D) / (T – t)
where:
- C = the number of concordant pairs
- D = number of discordant pairs
- T = total number of possible pairs
- t = number of tied ranks
Tau-C provides a more accurate measure of the association between two rankings than Tau-A or Tau-B when there are tied ranks. However, it is also computationally more intensive.
Example Problem
Example Question: Two interviewers ranked 12 candidates (A through L) for a position. The results from most preferred to least preferred are:
- Interviewer 1: ABCDEFGHIJKL.
- Interviewer 2: ABDCFEHGJILK.
Calculate the Kendall Tau correlation. Step 1: Make a table of rankings. The first column, “Candidate” is optional and for reference only. The rankings for Interviewer 1 should be in ascending order (from least to greatest). 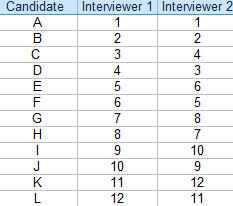
Step 2: Count the number of concordant pairs, using the second column. Concordant pairs are how many larger ranks are below a certain rank. For example, the first rank in the second interviewer’s column is a “1”, so all 11 ranks below it are larger. 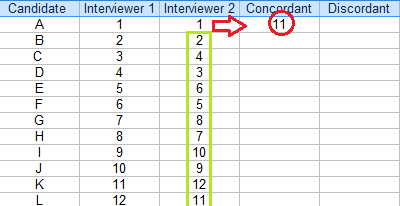
However, going down the list to the third row (a rank of 4), the rank immediately below (3) is smaller, so it doesn’t count for a concordant pair. 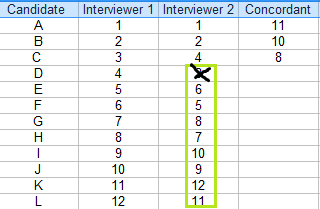
When all concordant pairs have been counted, it looks like this: 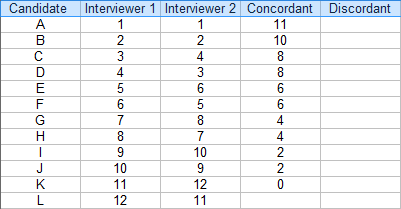
Step 3: Count the number of discordant pairs and insert them into the next column. The number of discordant pairs is similar to Step 2, only you’re looking for smaller ranks, not larger ones. 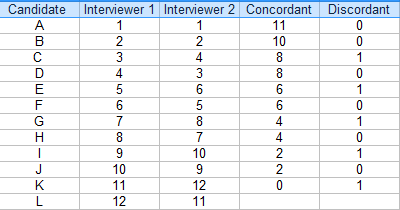
Step 4: Sum the values in the two columns: 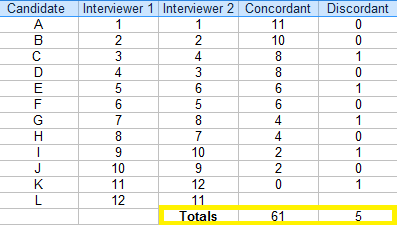
Step 5: Insert the totals into the formula: Kendall’s Tau = (C – D / C + D) = (61 – 5) / (61 + 5) = 56 / 66 = .85. The Tau coefficient is .85, suggesting a strong relationship between the rankings.
Perfect Agreement
Counting how many values are below the second column seems very odd when you first do it. But it does work. Just as a thought experiment, here’s what the spreadsheet looks like if both interviewers were in perfect agreement: 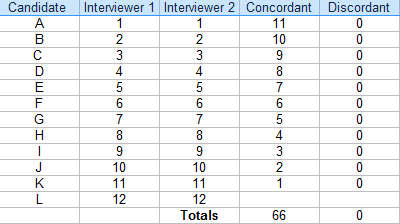
And, inserting the totals into the formula we get: Tau = (66 – 0) / (66 + 0) = 1, which is (as we expect) perfect agreement.
Calculating Statistical Significance
If you want to calculate statistical significance for your result, use this formula to get a z-value: ![]()
Inserting the values from our results: ![]() = 3 * .85 * 11.489 / 7.616 = 3.85. Finding the area for a z-score of 3.85 on a z-table gives an area of .0001 — a tiny probability value which tells you this result is statistically significant.
= 3 * .85 * 11.489 / 7.616 = 3.85. Finding the area for a z-score of 3.85 on a z-table gives an area of .0001 — a tiny probability value which tells you this result is statistically significant.
References
- Chok, N. (2008)/ PEARSON’S VERSUS SPEARMAN’S AND KENDALL’S CORRELATION COEFFICIENTS FOR CONTINUOUS DATA. Thesis. Retrieved August 1, 2023 from: https://d-scholarship.pitt.edu/8056/1/Chokns_etd2010.pdf
- Khamis H. Measures of Association: How to Choose? Journal of Diagnostic Medical Sonography. 2008;24:155-162.
- Corty EW. Using and Interpreting Statistics: A Practical Text for the Health, Behavioral, and Social Sciences. St. Louis, MO: Mosby, Inc; 2007.
- Lieberson S. Limitations in the Application of Non-Parametric Coefficients of Correlation. American Sociological Review. 1964; 29:744-746.
- Siegel S. Nonparametric Statistics. The American Statistician. 1957;11:13-19.
- Kendall, M. G. (1970). Rank Correlation Methods, 4th edition. London: Griffin