Intro to Statistics > Part 6: The Central Hypothesis
Previous: Statistics Case Studies
What is the Central Hypothesis?
The central hypothesis is another name for the Null Hypothesis. It’s central, not because you think or hope it’s true. Usually, it’s the exact opposite. For example, a pharmaceutical company testing a new drug obviously wants it to be shown effective via drug trial data, but their Null Hypothesis is that the drug is not effective. Then, they hope to reject the Null Hypothesis. The Null Hypothesis is central because it’s the hypothesis you are testing.
We can frame a statistical analysis simply by whether or not we reject the Null Hypothesis. But if desired, we can also formally state an Alternate Hypothesis that is to be accepted if the Null Hypothesis is rejected. As we’ll see, though, the Null Hypothesis is never accepted; it’s either rejected or not rejected—a subtle but fundamental difference.
The Null Hypothesis is a statement that may be ruled out by evidence (the sample data). Typically, the central hypothesis is an equality (and the optional Alternate Hypothesis is an opposing inequality). For example
- Null (Central hypothesis): The population percentage in favor is equal to 50%
- Alternate (optional): The population percentage in favor is not equal to 50%
With these terms, we can define Type I & II Errors more formally.
- Type I Error: Rejecting the Null Hypothesis when it is actually true. For example, the population is 50% in favor, but your sample leads you to reject that it’s 50% in favor.
- Type II Error: Not rejecting the Null Hypothesis when it is actually false. For example, the population is not 50% in favor, but your sample leads you to not reject that it is 50% in favor.
Central Hypothesis: A Classic Analogy
Let’s consider why the Null Hypothesis may be rejected or not rejected but never accepted. We’ll look at it a few different ways, starting with a classic analogy: There is a hypothesis that a certain animal native to Tasmania is extinct. That is the Null Hypothesis. A group of scientists goes out looking for it. If they find one, can they reject the Null Hypothesis that the animal is extinct? Yes, of course. But if they don’t find one, can they accept the Null Hypothesis that the animal is extinct? Of course not. The absence of evidence is not evidence of absence.
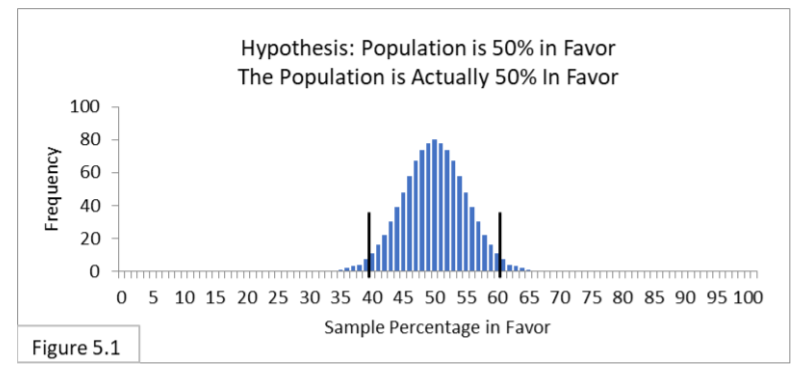
Now let’s look at some cases closer to home: Surveyor #1’s Null Hypothesis is that the Flowing Wells population is 50% in favor of a new public health policy. Her frame of reference is Figure 5.1 (below).
Surveyor #2’s Null Hypothesis is that the Flowing Wells population is 55% in favor of the same new public health policy. His frame of reference is Figure 6.1.
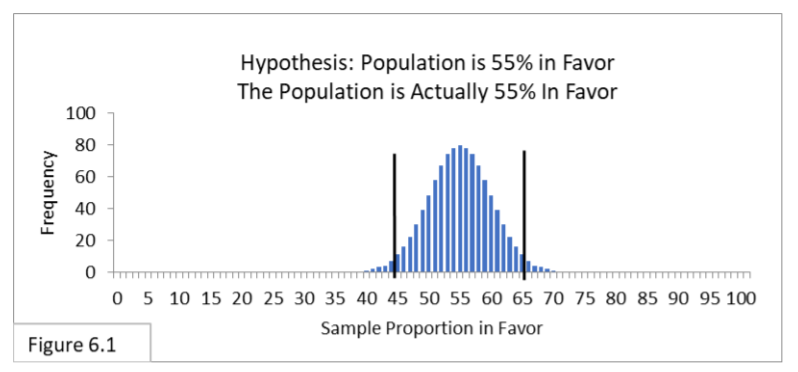
Both surveyors use the same survey sample of 100 random people, and the sample proportion turns out to be 53%. 53% is within both of the surveyors’ 95% intervals. If we allowed each of them to accept their central hypothesis, then she would accept the Null Hypothesis that the population proportion is 50%, and he would accept the Null Hypothesis that the population proportion is 55%. They can’t both be right!
No, they can’t both be right, and so we can’t let them accept their Null Hypothesis. Each can only not reject their Null Hypothesis.
Next, let’s look at a variation on that theme. We’ll use Figure 5.2, below.
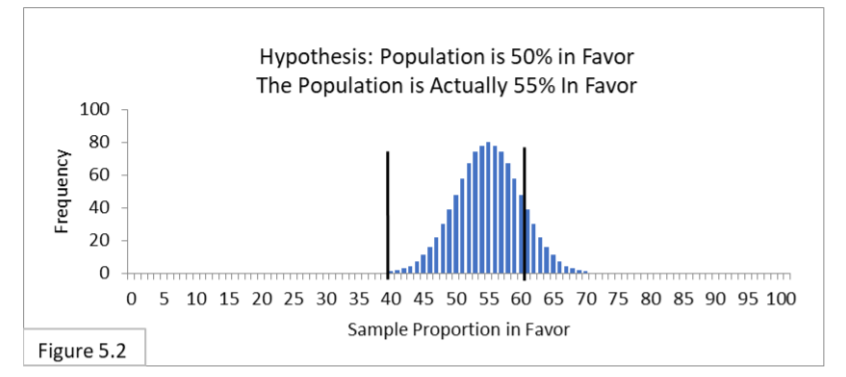
The null, or central hypothesis is that the Flowing Wells’ population proportion is equal to 50%, but let’s say that we, as know-it-alls, know that it’s actually equal to 55%. Here, a population that is actually 55% in favor has a sampling distribution with the majority of sample percentages within the 95% interval for 50%. Should all the surveyors who get sample proportions within the 40%-to-60% interval accept their Null Hypothesis and say they are confident that the population percentage is 50%?
No. All the surveyors whose percentages are outside the 40%-to-60% interval will reject the Null Hypothesis that the population percentage is 50%, and all the surveyors whose proportions are within the 40%-to-60% interval will not reject the Null Hypothesis (and unknowingly suffer Type II Error).
And finally, in many cases it would actually be very unlikely for the central hypothesis to be true anyway. Flowing Wells has 80,000 residents. For the Null Hypothesis that 50% of the Flowing Wells’ population is in favor of the new public health policy to be true, 40,000 residents must be in favor of the policy. Not 39,999. Not 40,001. It must be exactly 40,000. That’s another reason why we never accept the Null Hypothesis as true. It’s often too exacting. But always remember, the Null Hypothesis is something we want to see if we can reject; it’s not something we want to see if we can accept.
In a nutshell: We may infer that the central hypothesis is false, but we never infer that it’s true. If the evidence is strong enough, we reject the Null Hypothesis. And when we reject the Null Hypothesis, we call the result statistically significant. If the evidence is not strong enough, we don’t reject the Null Hypothesis. We never accept the Null Hypothesis.
Next: The Limited Meaning of Statistical Significance
References
J.E. Kotteman. Statistical Analysis Illustrated – Foundations . Published via Copyleft. You are free to copy and distribute the content of this article.