Statistics Definitions > What is Statistical Analysis?

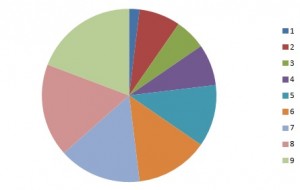
- Summarize the data. For example, make a pie chart.
- Find key measures of location. For example, the mean tells you what the average (or “middling”) number is in a set of data.
- Calculate measures of spread: these tell you if your data is tightly clustered or more spread out. The standard deviation is one of the more commonly used measures of spread; it tells you how spread out your data is about the mean.
- Make future predictions based on past behavior. This is especially useful in retail, manufacturing, banking, sports or for any organization where knowing future trends would be a benefit.
- Test an experiment’s hypothesis. Collecting data from an experiment only tells a story when you analyze the data. This part of statistical analysis is more formally called “Hypothesis Testing,” where the null hypothesis (the commonly accepted theory) is either proved or disproved.
Statistical Analysis and the Scientific Method
Statistical analysis is used extensively in science, from physics to the social sciences. As well as testing hypotheses, statistics can provide an approximation for an unknown that is difficult or impossible to measure. For example, the field of quantum field theory, while providing success in the theoretical side of things, has proved challenging for empirical experimentation and measurement. Some social science topics, like the study of consciousness or choice, are practically impossible to measure; statistical analysis can shed light on what would be the most likely or the least likely scenario.
When Statistics Lie
While statistics can sound like a solid base to draw conclusions and present “facts,” be wary of the pitfalls of statistical analysis. They include deliberate and accidental manipulation of results. However, sometimes statistics are just plain wrong. A famous example of “plain wrong” statistics is Simpson’s Paradox, which shows us that even the best statistics can be completely useless. In a classic case of Simpson’s, averages from University of Berkeley admissions (correctly) showed their average admission rate was higher for women than men, when in fact it was the other way around. For a more detailed explanation of that brain bender, see Simpson’s Paradox.
For some examples of deliberate (or plain dumb) manipulation of statistics, see: