Contents:
- What does it mean to support ot reject the null hypothesis?
- Support or Reject the null hypothesis: Steps
What does it mean to support or reject the null hypothesis?
In many statistical tests, the main goal is to either support or reject the null hypothesis. This means that we’re either going to keep the original hypothesis in place, or we’re not. For example, if your null hypothesis is that grass grows more than one inch per day, but an experiment shows it grows less than one inch per day, then you can throw out (reject) the null hypothesis.
For new statistics students, the term can be a tricky term to grasp, partly because the name “null hypothesis” doesn’t make it clear about what the null hypothesis actually is!
So, what exactly is the null hypothesis? You can think of it as a hypothesis that can be nullified or dismissed. If you reject the null hypothesis, it is replaced with the alternate hypothesis, which is what you suspect might be the actual truth about a particular situation.
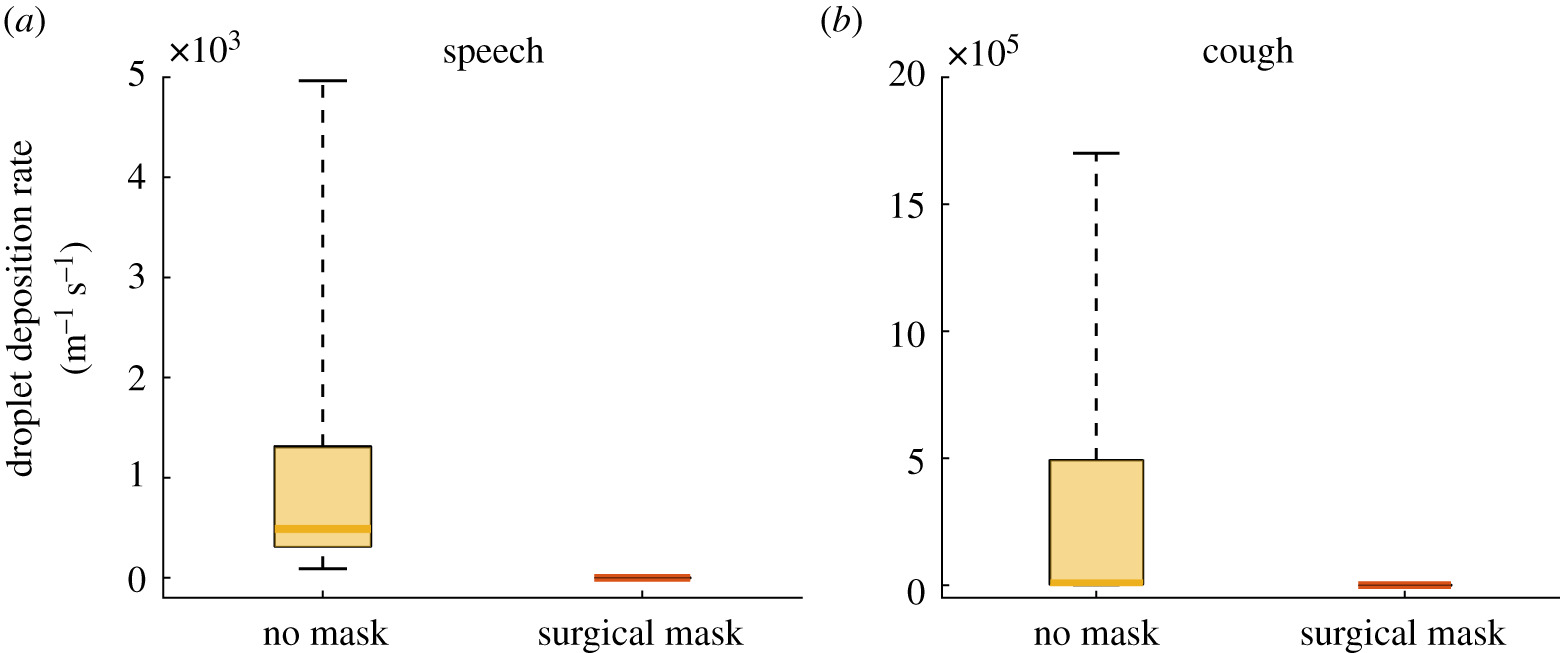
Let’s illustrate this with a real-life example. In the 1990s, researchers suspected that Fen-Phen, a “miracle” weight loss drug was linked to a recent surge in serious lung problems. American Home Products Corporation, who marketed the drug, believed it was safe.
- The null hypothesis is always the accepted hypothesis; in this scenario, the drug was on the market, people were taking it, and it was widely accepted as a safe drug for weight loss. Thus, the null hypothesis was that the drug is safe.
- The alternate hypothesis suggested that the drug wasn’t safe.
After some analysis by researchers, the null hypothesis that Fen-Phen was safe was rejected, and the drug was subsequently withdrawn from the market.
Support or Reject the Null Hypothesis: General steps
- State the null hypothesis. When you state the null hypothesis, you also have to state the alternate hypothesis. Sometimes it is easier to state the alternate hypothesis first, because that’s the researcher’s thoughts about the experiment.
- Support or reject the null hypothesis. You reject the null hypothesis when your test value falls into the rejection region.
- If you are able to reject the null hypothesis in Step 2, you can replace it with the alternate hypothesis.
The exact method you follow depends mainly on if you have a proportion or a p-value:
Support or Reject Null Hypothesis with a P Value
If you have a P-value, or are asked to find a p-value, follow these instructions to support or reject the null hypothesis. This method works if you are given an alpha level and if you are not given an alpha level. If you are given a confidence level, subtract from 1 to get the alpha level.
- State the null hypothesis and the alternate hypothesis (“the claim”). If you aren’t sure how to do this, follow this link for How To State the Null and Alternate Hypothesis.
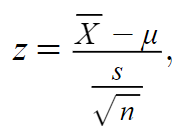
- Find the critical value. When beginning statistics, you usually deal with a normally distributed population, so the critical value will be found with a z-score. Use the following formula to find the z-score.
 Find the P-Value by looking up your answer from step 3 in the z-table. To get the p-value, subtract the area from 1. For example, if your area is .990 then your p-value is 1-.9950 = 0.005. Note: for a two-tailed test, you’ll need to halve this amount to get the p-value in one tail.
- Compare your answer from step 4 with the α value given in the question. If step 4 is less than or equal to α, reject the null hypothesis, otherwise do not reject it.
What p-value fails to reject the null hypothesis?
If the p-value is greater than the significance level, we usually do not reject the null hypothesis. A large p-value indicates that the data is not significant, so we cannot conclude that the null hypothesis is false. For example, if we set the significance level at 0.05 and the p-value is 0.10, then the p-value is larger than 0.05 and we would fail to reject the null hypothesis.
However, failing to reject the null hypothesis does not imply that the alternate hypothesis is true. It just means that the data does not provide sufficient evidence to conclude it is false.
To increase the certainty of rejecting the null hypothesis, choose a lower significance level. For example, setting the significance level to 0.01 would require the p-value to be less than or equal to 0.01 to reject the null hypothesis.
Refer to this rule of thumb to decide if you should support or reject the null hypothesis (the more “significant,” the more reason to reject the null):
- If p value > .10 → “not significant”
- If p value ≤ .10 → “marginally significant”
- If p value ≤ .05 → “significant”
- If p value ≤ .01 → “highly significant.”
Support or Reject Null Hypothesis for a Proportion
Sometimes, you’ll be given a proportion of the population or a percentage and asked to support or reject null hypothesis. In this case you can’t compute a test value by calculating a z-score (you need actual numbers for that), so we use a slightly different technique.
Example question 1: A researcher claims that Democrats will win the next election. 4300 voters were polled; 2200 said they would vote Democrat. Decide if you should support or reject null hypothesis. Is there enough evidence at α=0.05 to support this claim?
- State the null hypothesis and the alternate hypothesis (“the claim”). Ho:p ≤ 0.5 H1:p > .5
- Compute
 by dividing the number of positive respondents from the number in the random sample: 2200/4300 = 0.512.
 - Use the following formula to calculate your test value.
 Where: P-hat is calculated in Step 2, p is the null hypothesis p value (.05), q is 1 – p, which gives us a z-score of 512 – .5 / √(.5(.5) / 4300)) = 1.57
 - Look up Step 3 in the z-table to get .9418.
- Calculate your p-value by subtracting Step 4 from 1. 1-.9418 = .0582
- Compare your answer from step 5 with the α value given in the question. Support or reject the null hypothesis? If step 5 is less than α, reject the null hypothesis, otherwise do not reject it. In this case, .582 (5.82%) is not less than our α, so we do not reject the null hypothesis.
Example question 2: A researcher claims that more than 23% of community members go to church regularly. In a recent survey, 126 out of 420 people stated they went to church regularly. Is there enough evidence at α = 0.05 to support this claim? Use the P-Value method to support or reject null hypothesis.
- State the null hypothesis and the alternate hypothesis (“the claim”). Ho:p ≤ 0.23; H1:p > 0.23 (claim).
- Compute by dividing the number of positive respondents from the number in the random sample: 63 / 210 = 0.3.
- Find ‘p’ by converting the stated claim to a decimal: 23% = 0.23. Also, find ‘q’ by subtracting ‘p’ from 1: 1 – 0.23 = 0.77.
- Use the following formula to calculate your test value.
- If formulas confuse you, this is asking you to:
- Subtract p from(0.3 – 0.23 = 0.07). Set this number aside.
- Multiply p and q together, then divide by the number in the random sample. (0.23 x 0.77) / 420 = 0.00042
- Take the square root of your answer to 2. √(0.1771) = 0.0205
- Divide your answer to 1. by your answer in 3. 0.07 / 0.0205 = 3.41
- Subtract p from
- Find the P-Value by looking up your answer from step 5 in the z-table. The z-score for 3.41 is .4997. Subtract from 0.500: 0.500-.4997 = 0.003.
- Compare your P-value to α. If the P-value is less, reject the null hypothesis. If the P-value is more, keep the null hypothesis. 0.003 < 0.05, so we have enough evidence to reject the null hypothesis and accept the claim.
Note: In Step 5, I’m using the z-table on this site to solve this problem. Most textbooks have the right of z-table. If you’re seeing .9997 as an answer in your textbook table, then your textbook has a “whole z” table, in which case don’t subtract from .5, subtract from 1. 1-.9997 = 0.003.
Check out our Youtube channel for video tips!
How do you know when to reject the null hypothesis?
To determine whether or not to reject the null hypothesis, two common criteria are typically considered:
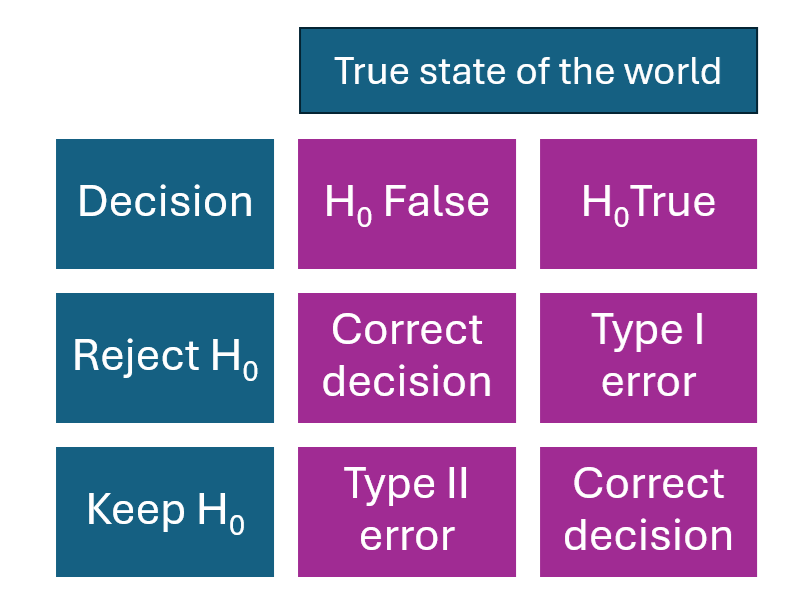
- Significance (alpha) level: The significance level represents the probability of committing a Type I error, which involves mistakenly rejecting the null hypothesis when it is actually true. The most commonly used significance level is 0.05, implying a willingness to accept a 5% chance of committing a Type I error.
- Power: Power refers to the probability of correctly rejecting the null hypothesis when it is false. Higher power indicates a greater likelihood of rejecting the null hypothesis when it is false, thereby reducing the probability of a Type II error.
In a nutshell, the null hypothesis can be rejected if the test results are statistically significant, which means that they are unlikely to have happened by chance. This determination can be made by comparing the p-value of the results with the significance level.
However, even when the results are significant, exercise caution if the power is low. This is because low power increases the likelihood of committing a Type I error. Therefore, in real life studies, you should ideally take into account both the significance level and power when deciding whether or not to reject the null hypothesis.
Other factors can to take into account:
- Effect size: Larger effect sizes are more likely to lead to rejecting the null hypothesis.
- Consequences of a Type I error: If there is a high cost associated with making a Type I error, it may be prudent to be more conservative and not reject the null hypothesis, even when the results are significant. For example, if a drug trial incorrectly indicates that a drug is safe, the drug may be prescribed to patients — even though it may be harmful.
- Consequences of a Type II error: If the cost of making a Type II error is high, it may be more appropriate to reject the null hypothesis, even if the power is low. For example, if a medical test incorrectly indicates a patient doesn’t have a disease, they may miss out on life-saving treatment.
What is the difference between failing to reject the null hypothesis and having evidence to support the alternate hypothesis?
Not rejecting the null hypothesis and having evidence for the alternative hypothesis are two entirely different concepts.
Not rejecting the null hypothesis signifies that the data does not provide sufficient evidence to conclude that the null hypothesis is false. The data may, or may not, align with either of the hypotheses.
Having evidence to support the alternative hypothesis indicates that the data offers some indication that the null hypothesis is false. However, it is important to note that evidence is not equivalent to proof. Merely having evidence for the alternative hypothesis does not guarantee its validity. And although I’m saying “support the alternate hypothesis” here to illustrate the point, statistical tests don’t actually provide support for the alternate hypotheses; instead, they provide evidence to throw out the null (and put the alternate in its place).
References
- Authors of the study: Lucia Bandiera, Geethanjali Pavar, Gabriele Pisetta, Shuji Otomo, Enzo Mangano, Jonathan R. Seckl, Paul Digard, Emanuela Molinari, Filippo Menolascina and Ignazio Maria Viola, CC BY 4.0 , via Wikimedia Commons