Multivariate Analysis > Wilks’ Lambda
What is Wilks’ Lambda?
Wilks’ lambda (Λ) is a test statistic that’s reported in results from MANOVA , discriminant analysis, and other multivariate procedures. Other similar test statistics include Pillai’s trace criterion and Roy’s ger criterion.
- In MANOVA, Λ tests if there are differences between group means for a particular combination of dependent variables. It is similar to the F-test statistic in ANOVA. Lambda is a measure of the percent variance in dependent variables not explained by differences in levels of the independent variable. A value of zero means that there isn’t any variance not explained by the independent variable (which is ideal). In other words, the closer to zero the statistic is, the more the variable in question contributes to the model. You would reject the null hypothesis when Wilk’s lambda is close to zero, although this should be done in combination with a small p-value.
- In discriminant analysis, Wilk’s lambda tests how well each level of independent variable contributes to the model. The scale ranges from 0 to 1, where 0 means total discrimination, and 1 means no discrimination. Each independent variable is tested by putting it into the model and then taking it out — generating a Λ statistic. The significance of the change in Λ is measured with an F-test; if the F-value is greater than the critical value, the variable is kept in the model. This stepwise procedure is usually performed using software like Minitab, R, or SPSS. The following SPSS output shows which variables (from a list of a dozen or more) were kept in using this procedure.
SPSS Wilk’s Lambda output. Image: Bournemouth University.
Formula
Need help with calculations? Check out our tutoring page!
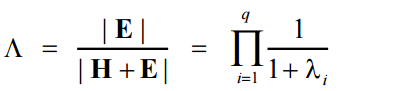
1 – λ in the denominator is the proportion of variance in dependent variables explained by the model’s effect. Caution should be used in interpreting results as this statistic tends to be biased, especially for small samples.
Output Components
Wilks’ lambda output has several components, including:
- “Sig” or significance (p-value). If this is small, (i.e. under .05) reject the null hypothesis.
- “Value” column in the output: the value of Wilk’s Lambda.
- “Statistic” is the F-statistic associated with the listed degrees of freedom. It would be reported in APA format as F(df1,df2) = value. For example, if you had an f-value of 36.612 with 1 and 2 degrees of freedom you would report that as F(1,2) = 36.612.
References
Elliot, A. (2006). Statistical Analysis Quick Reference Guidebook: With SPSS Examples 1st Edition. SAGE.
Nath, R. and Pavur, R. (1985) A new statistic in the one way multivariate analysis of variance, Computational Statistics and Data Analysis, 2, 297–315.
Todorov, V. and Filzmoser, P. (2007) Robust statistic for the one-way MANOVA, submitted to the Journal of Environmetrics.