Probability and Statistics > Excel for Statistics > Two Sample z Test Excel 2013
Two Sample z Test Excel 2013: Overview
A two sample z test in Excel compares the means of two sets of data to see if there’s a difference. You run a z test to test the null hypothesis. You use the p value from the test to decide whether to support or reject the null hypothesis. For example, you might be asked by a manufacturer to test if some new product is superior to a previous product in shelf life. You would start by stating the null hypothesis (there’s no difference) and then state your alternate hypothesis: there IS a difference in means. Once you’ve figured out your null and alternate hypotheses, you’re ready to run the z test in Excel.
Two Sample z Test Excel 2013: Steps
Step 1: Type your data into two columns (one for your “before” or “old” data and one for your “after” or “new” data).
Step 2: Run the Excel VAR function for each sample to find the variance. The format is:
=VAR(A1:A100)
Where “A1:A100” is the cell locations for your data. In this example, your data is in cells A1 to A100. Make sure you run the VAR function twice to find the variance for each sample.
Step 3: Click the “Data” tab and then click “Data Analysis.” If you don’t see Data Analysis at the right of the toolbar, load the Data Analysis Toolpak.
Step 4: Type the locations for your variable 1 data (sample 1) into the first text box. For example, if your data is in cells A1 to A100, type: “A1:A100” into the box.
Step 5: Type the locations for your variable 2 data (sample 2) into the second text box. For example, if your data is in cells B1 to B100, type: “B1:B100” into the box.
Step 6: Type “0” into the hypothesized mean difference box. In the vast majority of cases, you’ll put 0 here. Why? Because your null hypothesis is there’s no difference. If your null hypothesis states there IS a difference in means, you would put that difference here.
Step 7: Type the variances you calculated into Step 2 into the Variance 1 and 2 text boxes.
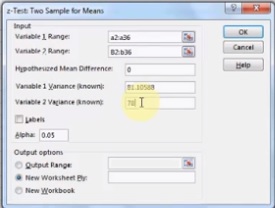
Step 8: Choose an alpha level. If it isn’t specified in the question, 0.05 is a standard value.
Step 8: Choose an output area. For example, click “New Worksheet.”
Step 9: Click:”OK.”
Step 10: Compare the alpha level (i.e. 0.05) to the p value in the output. If the p value in the output is smaller than the alpha level, reject the null hypothesis.
Note: There are two p-values in the output: one tailed test and two tailed test. Not sure if you have a one tailed test or two? See: One tailed test or two: How to Decide.
Warning: You can only run a two sample z test Excel if your sample size is greater than 30. Below 30, run a t-test in Excel.
References
Salkind, N. (2016). Statistics for People Who (Think They) Hate Statistics: Using Microsoft Excel 4th Edition.