Probability Distribution: List of Statistical Distributions
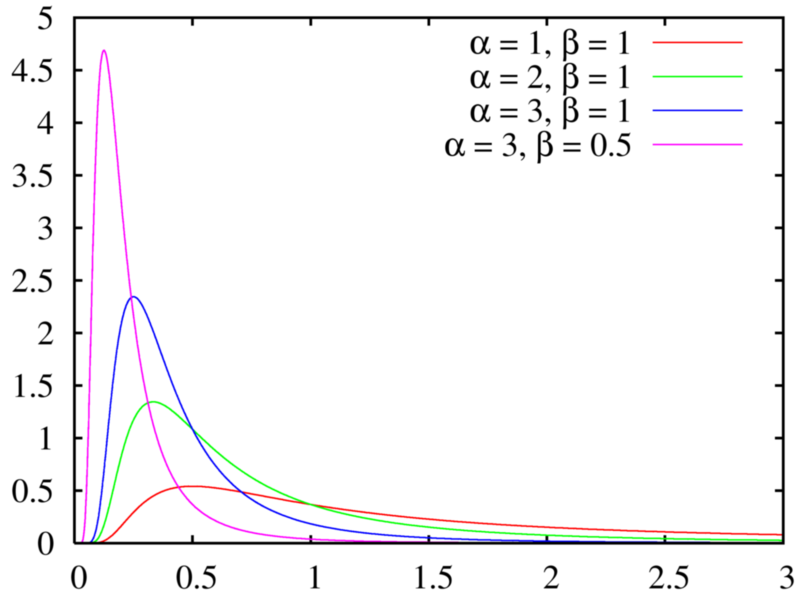
A severity distribution (or loss severity distribution) is a probability distribution of the amount of losses incurred per operational loss event. As it is a distribution (rather than a single figure or set of numbers), it doesn’t put a dollar amount on the loss. Rather, it shows the variability, or spread, for the possible size of the loss (Klaassen & Eeghen, 2009).
Parametric and Nonparametric Severity Distribution
There are two ways to estimate the severity distribution: parametric and non-parametric (Liu & Forrest, 2010). “Parametric” means that you know the general shape of the distribution. In a non-parametric method, no distribution is assumed.

While a normal distribution can be used for a severity distribution, it does come with a couple of issues. First, the distribution is centered at zero, which means that half of the values are negative and half are positive. The best data to fit this shape would be data with a high mean (relative to the standard deviation), resulting in nearly all positive data points. That said, the tails of the normal distribution are relatively short, so the major issue is that not enough weight would be given to low value data points (Liu & Forrest, 2010).
References
De Luca, G. et al.(2020). Statistical Analysis of Operational Risk Data.
Klaassen, P. & Eeghen, I. (2009). Economic Capital: How It Works, and What Every Manager Needs to Know 1st Edition. Elsevier Science
Liu, S. & Forrest, J. (2010). Advances in Grey Systems Research (Understanding Complex Systems). Springer.
Promislow, D. (2014). Fundamentals of Actuarial Mathematics. Wiley.