What is a Parabolic Distribution?
A parabolic distribution is any distribution that has the shape of a parabola. Many different probability distributions from a wide variety of families can be parabolic in shape.

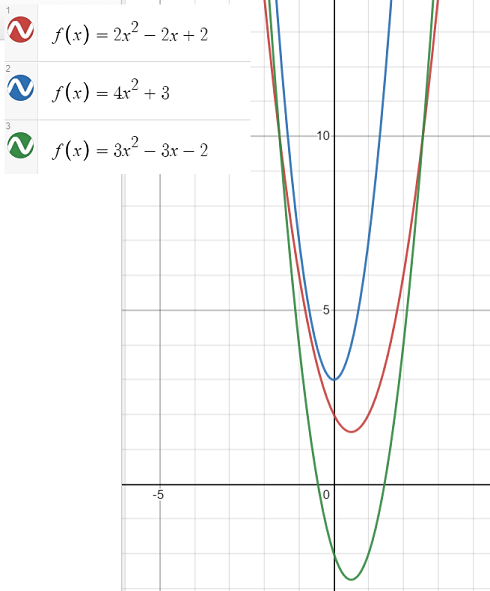
A parabolic relationship arises when two variables interact in such a way that their representation on a graph takes the shape of a parabola. This unique curve, which opens either upward or downward, is defined by a quadratic equation and is readily recognized by its signature U-shape. The study of parabolic relationships has proven to be enormously valuable, as they appear in various scientific and real-world applications such as in the investigation of projectile motion, the design of satellite dishes and the analysis of certain economic models. By unraveling the principles behind the parabolic relationship, mathematicians and scientists can better understand and predict the behavior of various systems and phenomena.
Examples of Parabolic Distribution
In general, if a probability distribution can be modeled with a quadratic function (creating a U or upside down U), then that distribution is parabolic. For example, the following distribution [1], which is a quadratic function, is parabolic:
f(xi) = 6(xi – A)(B – xi) / (B – A)2.
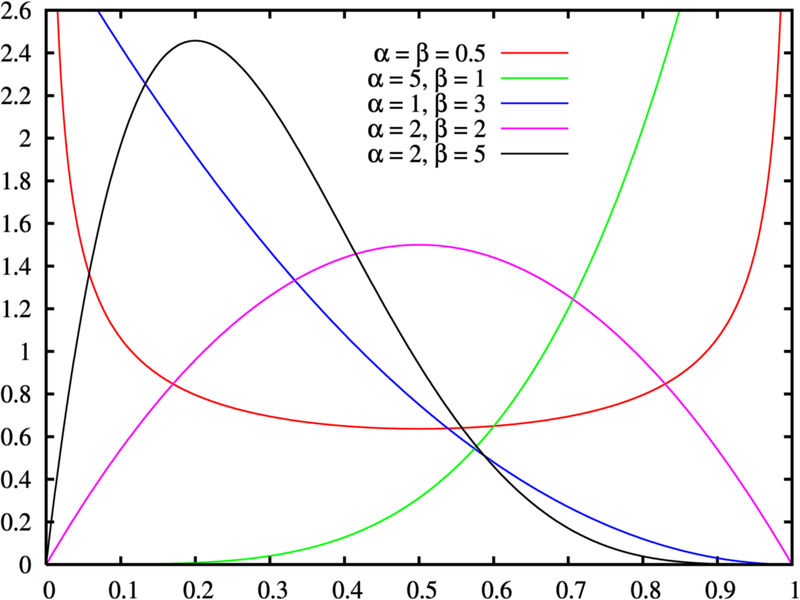
The beta distribution can take on many different shapes, from u-shaped curves to bell curves. However, when α = β = 2, the distribution becomes parabolic.

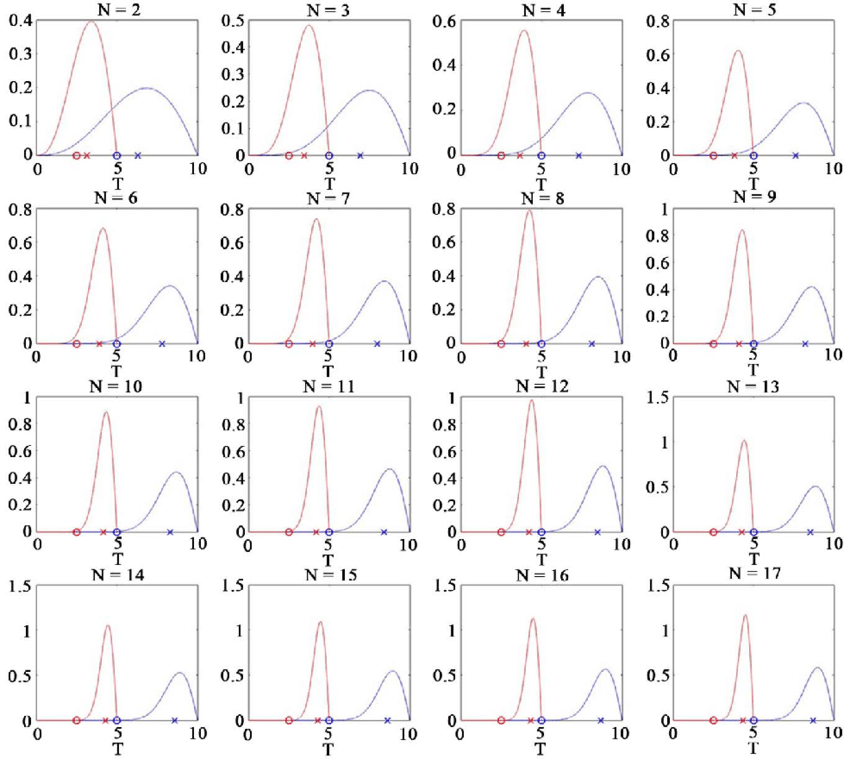
The following image shows two examples of a parabolic distribution. If your data plots like these graphs then it has a parabolic relationship: a = 5 (red) and a = 10 (blue). The x-axis is a random variable (T), and the y-axis shows the probability density of T [2].
If you have a set of data that makes a parabola and you need to find the best fit equation, use quadratic regression.
Parabolic distributions of order 2 are members of the location-scale family of distributions.
References
Graph created with Desmos.com.
[1] Meloun, M. & Militky, J. Errors in instrumental measurements.
[2] Image: Motohisa Osaka via Researchgate. CC by 4.0.