Hypothesis Testing > Likelihood-Ratio Tests Contents:
What is a Likelihood-Ratio Test?
The Likelihood-Ratio test (sometimes called the likelihood-ratio chi-squared test) is a hypothesis test that helps you choose the “best” model between two nested models. “Nested models” means that one is a special case of the other. For example, you might want to find out which of the following models is the best fit:
- Model One has four predictor variables (height, weight, age, sex),
- Model Two has two predictor variables (age,sex). It is “nested” within model one because it has just two of the predictor variables (age, sex).
This theory cam also be applied to matrices. For example, a scaled identity matrix is nested within a more complex compound symmetry matrix. The best model is the one that makes the data most likely, or maximizes the likelihood function, fn(X – 1, … , Xn|Θ).
Although the concept is relatively easy to grasp (the likelihood function is highest nearer the true value for Θ), the calculations to find the inputs for the procedure are not. Likelihood-ratio tests use log-likelihood functions, which are difficult and lengthy to calculate by hand. Most statistical software packages have built in functions to handle them; On the other hand, log-likelihood functions pose other serious challenges, like the difficulty of calculating global maximums. These often involve hefty computations with complicated, multi-dimensional integrals.
Running the Test
Basically, the test compares the fit of two models. The null hypothesis is that the smaller model is the “best” model; It is rejected when the test statistic is large. In other words, if the null hypothesis is rejected, then the larger model is a significant improvement over the smaller one. If you know the log-likelihood functions for the two models, the test statistic is relatively easy to calculate as the ratio between the log-likelihood of the simpler model (s) to the model with more parameters (g): 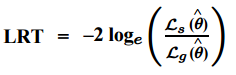
You might also see this equation with “s” written as the likelihood for the null model and “g” written as the likelihood for the alternative model. The test statistic approximates a chi-squared random variable. Degrees of freedom for the test equal the difference in the number of parameters for the two models.
Likelihood ratio in medicine
You may want to read this article first: Sensitivity vs. Specificity.
Likelihood ratios (LR) in medical testing are used to interpret diagnostic tests. Basically, the LR tells you how likely a patient has a disease or condition. The higher the ratio, the more likely they have the disease or condition. Conversely, a low ratio means that they very likely do not. Therefore, these ratios can help a physician rule in or rule out a disease.
Formulas
The formula for the likelihood ratio (LR) is:![]()
Tests can be either positive or negative, so there are two ratios:
- Positive LR: This tells you how much to increase the probability of having a disease, given a positive test result. The ratio is:
Probability a person with the condition tests positive (a true positive) /
probability a person without the condition tests positive (a false positive). - Negative LR: This tells you how much to decrease the probability of having a disease, given a negative test result. The ratio is:
Probability a person with the condition tests negative (a false negative) /
probability a person without the condition tests negative (a true negative).
Sensitivity and specificity are an alternative way to define the likelihood ratio:
- Positive LR = sensitivity / (100 – specificity).
- Negative LR = (100 – sensitivity) / specificity.
Interpreting Likelihood Ratios
Likelihood ratios range from zero to infinity. The higher the value, the more likely the patient has the condition. As an example, let’s say a positive test result has an LR of 9.2. This result is 9.2 times more likely to happen in a patient with the condition than it would in a patient without the condition.
A rule of thumb [1, 2] for interpreting them:
- 0 to 1: decreased evidence for disease. Values closer to zero have a higher decrease in probability of disease. For example, a LR of 0.1 decreases probability by -45%, while a value of -0.5 decreases probability by -15%.
- 1: no diagnostic value.
- Above 1: increased evidence for disease. The farther away from 1, the more chance of disease. For example, a LR of 2 increases the probability by 15%, while a LR of 10 increases the probability by 45%. An LR over 10 is very strong evidence to rule in a disease.
Real Life Example
Sloane (2008) offers the following example for a serum ferritin test, which test for iron deficiency anemia. The LR for the test is:
| Result (mg/dl) | Likelihood Ratio |
| ≤ 15 | 51.8 |
| 15 – 24 | 8.8 |
| 25 – 34 | 2.5 |
| 45 – 100 | 0.5 |
| ≥ 100 | 0.08 |
The LR of 51.8 for the under 15 mg/dL result very strong evidence to rule in iron deficiency anemia. On the other hand, the very low LR of 0.08 is clear evidence there is no anemia. Scores in between are open to interpretation; further tests may be needed.
Bayes Theorem and the LR
In theory, the LR tells you if a test is correct. In practice, it isn’t used very much. This could be because Bayes’ Theorem (the theory behind pre-test and post-test probabilities) is not very easy to understand. However, you don’t need to comprehend the inner workings of the theorem to understand the Likelihood ratio form of the theorem:
For example, let’s say a patient returning from a vacation to Rio presents with a fever and joint pain. Past data tells you that 70% of patients in your practice who return from Rio with a fever and joint pain have Zika. The blood test result is positive, with a likelihood ratio of 6. To calculate the probability the patient has Zika:
- Convert the pre-test probability to odds:
0.7 / (1 – 0.7) = 2.33. - Use the formula to convert pre-test to post-test odds:
Post-Test Odds = Pre-test Odds * LR = 2.33 * 6 = 13.98. - Convert the odds in Step 2 back to probability:
(13.98) / (1 + 13.98) = 0.93.
There is a 93% chance the patient has Zika.
Likelihood ratio statistic
The likelihood-ratio statistic (also called the deviance statistic) is used to compare the likelihood of the data under the null hypothesis to the likelihood of the data under the alternate hypothesis. The likelihood of the data quantifies the probability of the data occurring under a given hypothesis.
To calculate the likelihood-ratio statistic, subtract the likelihood of the data under the null hypothesis from the likelihood of the data under the alternate hypothesis, and then take the logarithm of the result. Next, compare the likelihood-ratio statistic to a critical value. If the likelihood-ratio statistic exceeds the critical value, reject the null hypothesis. The likelihood-ratio statistic is used for testing a test value of a parameter of interest for large samples. The statistic follows an asymptotic chi-squared distribution, meaning that it approximates a chi-squared distribution as the sample size tends to infinity. It can be defined as [3]
χ2LR =-2 * ln[LR(π) Where
- χ2LR =-the likelihood-ratio statistic
- π is the parameter of interest
- LR = likelihood ratio (Sensitivity and specificity are one way to define the likelihood ratio: Positive LR = sensitivity / (100 – specificity)).
The overall statistical power of the Wald statistic is better than the likelihood-ratio statistic as well as the score and the generalized score for small to medium sample sizes [4].
The likelihood-ratio statistic defined here is quite different from test statistics commonly used in elementary courses, such as the score and Wald statistics. It requires applying calculus, specifically using a Taylor-series expansion, to show the remarkable fact that the χ2score, based on the number of cases as the test statistic in the formula
χ2LR =-2 * ln [LR(π)]
can be used when the sample size is large enough and the test value has reasonably high support [5].
References
- McGee, S. Simplifying Likelihood Ratios. J Gen Intern Med. 2002 Aug; 17(8): 647–650. Available here.
- Sloane, P. 2008. Essentials of Family Medicine. Lippincott Williams & Wilkins.
- Rothman, K. et al. (2008). Modern Epidemiology. Wolters Kluwer Health/Lippincott Williams & Wilkins.
- Yi, Y. & Wang, X. Comparison of Wald, Score, and Likelihood Ratio Tests for Response Adaptive Designs. Journal of Statistical Theory and Applications. Volume 10, Number 4, 2011, pp. 553-569 ISSN 1538-7887
- COX, D. R. HINKLEY, D. V. Theoretical Statistics. 1974 [PDF]