Contents:
- What is Sensitivity (True Positive Rate)?
- What is Specificity (True Negative Rate)?
- Positive Predicted Values
- Negative Predicted Values
Watch the video for an overview of sensitivity and specificity, or read on below:
What is a Sensitive Test?
The sensitivity of a test (also called the true positive rate) is defined as the proportion of people with the disease who will have a positive result. In other words, a highly sensitive test is one that correctly identifies patients with a disease. A test that is 100% sensitive will identify all patients who have the disease. It’s extremely rare that any clinical test is 100% sensitive. A test with 90% sensitivity will identify 90% of patients who have the disease, but will miss 10% of patients who have the disease.
A highly sensitive test can be useful for ruling out a disease if a person has a negative result. For example, a negative result on a pap smear probably means the person does not have cervical cancer. The acronym widely used is SnNout (high Sensitivity, Negative result = rule out).
Back to Top
What is a Specific Test?
The specificity of a test (also called the True Negative Rate) is the proportion of people without the disease who will have a negative result. In other words, the specificity of a test refers to how well a test identifies patients who do not have a disease. A test that has 100% specificity will identify 100% of patients who do not have the disease. A test that is 90% specific will identify 90% of patients who do not have the disease.
Tests with a high specificity (a high true negative rate) are most useful when the result is positive. A highly specific test can be useful for ruling in patients who have a certain disease. The acronym is SPin (high Specificity, rule in).
What is a “High” Range?
What qualifies as “high” sensitivity or specificity varies by the test. For example the cut-offs for Deep Vein Thrombosis and Pulmonary Embolism tests range from 200-500 ng/dL (Pregerson, 2016).
Back to Top
High sensitivity/low specificity example

Low sensitivity/high specificity example
An example of this type of test is the nitrate dipstick test used to test for urinary tract infections in hospitalized patients (e.g. 27% sensitive, 94% specific).
Back to Top
What is a Positive Predictive Value?
The positive predictive value (PPV) is the probability that a positive result in a hypothesis test means that there is a real effect. It is the probability of patients who have a positive test result actually having the disease. It’s commonly used in medical testing where a “positive” result means that you actually have the disease. For example, let’s say you were tested for a type of cancer and the test had a PPV of 15.2%. That means if your test came back positive, you’d have a 15.2% chance of actually having cancer. In other words, a positive test result doesn’t necessarily mean that you have a particular disease. For example, a positive test result on a mammogram may mean that your chances of having breast cancer (i.e. the positive predictive value) is only ten percent.
A positive predictive value is one way (along with specificity, sensitivity and negative predictive values) of evaluating the success of a screening test.
Positive predictive values are influenced by how common the disease is in the population being tested; if the disease is very common, a person with a positive test result is more likely to actually have the disease than if a person has a positive test in a population where the disease is rare.
Calculating the Positive Predictive Value
Positive predictive values can be calculated in several ways. Two of the most common are:
Positive Predictive Value = number of true positives / number of true positives + number of false positives
or
Positive Predictive Value = Sensitivity x Prevalence / Sensitivity x prevalence + (1- specificity) x (1-prevalence)
Sensitivity is the proportion of people with the disease who will have a positive test result.
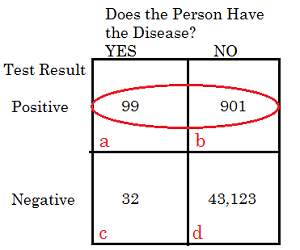
The predictive value can be calculated from a 2×2 contingency table, like this one:

The two pieces of information you need to calculate the positive predictive value are circled: the true positive rate (cell a) and the false positive rate (cell b).
Using the formula:
Positive predictive Value = True Positive Rate / (true positive rate + false positive rate)*100
For this particular set of data:
Positive predictive value = a / (a + b) = 99 / (99 + 901) * 100 = (99/1000)*100 = 9.9%. That means that if you took this particular test, the probability that you actually have the disease is 9.9%.
A good test will have lower numbers in cells b (false positive) and c (false negative). This makes sense, as a perfect test will only have numbers in the true positive and true negative locations. In reality though, perfect tests don’t exist. In addition, PPV is affected by the prevalence of the disease in the population. The more people that have the disease, the better the PPV at predicting odds.
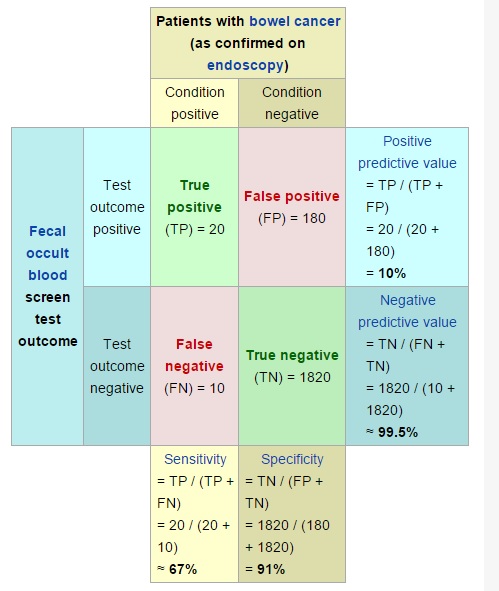
The following picture (courtesy of Wikipedia) shows a PPV of just 10%, obtained by dividing the true positives (20) by true positives (20) and false positives (180). That means this test carries the risk of a high false positive rate.

Positive Predictive values can be calculated from any contingency table. The Online Validity Calculator on this BU.EDU page (scroll to the bottom of the page) will calculate positive predictive values using a contingency table.
Positive Predictive Value vs. Sensitivity of a Test
The Positive Predictive Value definition is similar to the sensitivity of a test and the two are often confused. However, PPV is useful for the patient, while sensitivity is more useful for the physician. Positive predictive value will tell you the odds of you having a disease if you have a positive result. This can be useful in letting you know if you should panic or not. On the other hand, the sensitivity of a test is defined as the proportion of people with the disease who will have a positive result. This fact is very useful to physicians when deciding which test to use, but is of little value to you if you test positive.
Back to Top
Negative Predictive Value
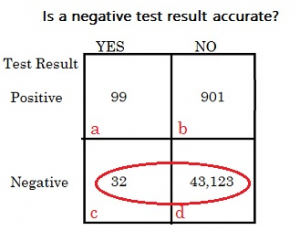
The negative predictive value is the probability that people who get a negative test result truly do not have the disease. In other words, it’s the probability that a negative test result is accurate.
The formula to find the negative predicted value is:
Negative predictive Value = True Negative Rate / (true negative rate + false negative rate)*100

For the above set of data:
Negative predictive value = d / (c + d) = 43123 / (32 + 4323) * 100 = (43123/43155)*100 = 99.9%. That means that if you took this particular test and received a negative result, the probability that you don’t have the disease is 99.9%.
References
Beyer, W. H. CRC Standard Mathematical Tables, 31st ed. Boca Raton, FL: CRC Press, pp. 536 and 571, 2002.
Dodge, Y. (2008). The Concise Encyclopedia of Statistics. Springer.
Everitt, B. S.; Skrondal, A. (2010), The Cambridge Dictionary of Statistics, Cambridge University Press.
Kotz, S.; et al., eds. (2006), Encyclopedia of Statistical Sciences, Wiley.