What is a Likelihood Function?
Many probability distributions have unknown parameters; We estimate these unknowns using sample data. The Likelihood function gives us an idea of how well the data summarizes these parameters.
The “parameters” here are the parameters for a probability distribution function (PDF). In other words, they are the building blocks for a PDF, or what you need for parametrization.
Simple Example
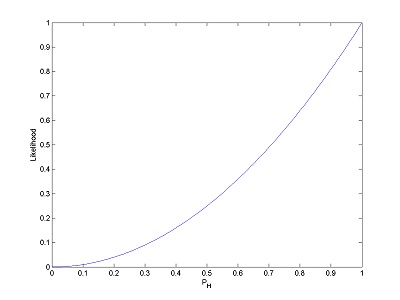
Let’s say you’re interested in creating a PDF that represents binomial probabilities for getting a heads (or tails) in a single coin toss. You’re going to estimate the likelihood of getting heads from your data, so you run an experiment.
If you get two heads in a row, your likelihood function for the probability of a coin landing heads-up will look like this:
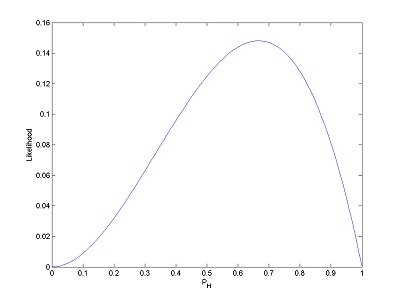
If you toss once more and get tails (making HHT), your function changes to look like this:
Although a likelihood function might look just like a PDF, it’s fundamentally different. A PDF is a function of x, your data point, and it will tell you how likely it is that certain data points appear. A likelihood function, on the other hand, takes the data set as a given, and represents the likeliness of different parameters for your distribution.
Defining Likelihood Functions in Terms of Probability Density Functions
Suppose the joint probability density function of your sample
X = (X1,…X2) is f(x| θ), where θ is a parameter. X = x is an observed sample point. Then the function of θ defined as
L(θ |x) = f(x |θ)
is your likelihood function.
Here it certainly looks like we’re just taking our PDF and cleverly relabeling it as a likelihood function. The reality, though, is actually quite different. For your PDF, you thought of θ as a constant and focused on an ever changing x. In the likelihood function, you let a sample point x be a constant and imagine θ to be varying over the whole range of possible parameter values.
If we compare two points on our probability density function, we’ll be looking at two different values of x and examining which one has more probability of occurring. But for the likelihood function, we compare two different parameter points. For example, if we find that L(θ1 | x) > L(θ2 | x), we know that our observed point x is more likely to have been observed under parameter conditions θ = θ1 rather than θ = θ2.
Properties of Likelihoods
Unlike probability density functions, likelihoods aren’t normalized. The area under their curves does not have to add up to 1.
In fact, we can only define a likelihood function up to a constant of proportionality. What that means that, rather than being one function, likelihood is an equivalence class of functions.
Using Likelihoods
Likelihoods are a key part of Bayesian inference. We also use likelihoods to generate estimators; we almost always want the maximum likelihood estimator.
References
Robinson, E. (2016). Introduction to Likelihood Statistics. Retrieved December 23, 2017 from:
https://hea-www.harvard.edu/AstroStat/aas227_2016/lecture1_Robinson.pdf
Wasserman, L. (n.d.). Lecture Notes 6 1 The Likelihood Function – CMU Statistics
Retrieved December 23, 2017 from: http://www.stat.cmu.edu/~larry/=stat705/Lecture6.pdf
Zhang, K. (2011). Principles of Data Reduction. In Special Topics in Statistical Theory.
Retrieved December 23, 2017 from: http://www.math.ntu.edu.tw/~hchen/teaching/StatInference/notes/ch6.pdf