Contents:
What is an “Area Under the Curve?”
The area under a curve is the area between the line of a graph (which is often curved) and the x-axis.
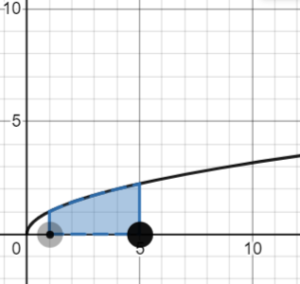
In calculus, you find the area under the curve using definite integrals.
Watch the video for an overview of definite integrals:
The Area Function
In calculus, an area function finds the area between a function and the x-axis. These are calculated with definite integrals. The area function is formulated differently depending on whether the area is above the x-axis (example 1), below the x-axis (example 2) or a combination of the two (example 3).

A couple of very useful online calculators:
- This Desmos calculator will show you the different shadings for any function; You’ll want to make this your first step as it will show you whether you’re dealing with a positive area, negative area, or a combination.
- Desmos’s calculator will also calculate the definite integral for you. For steps, use Go to Symbolab’s Calculator, which I use in the examples below.
Above The X-Axis
Example question: What is the area of the function f(x) = x2 between x = 1 and x = 5?
Solution:
Step 1: Graph the Area (using Desmos):
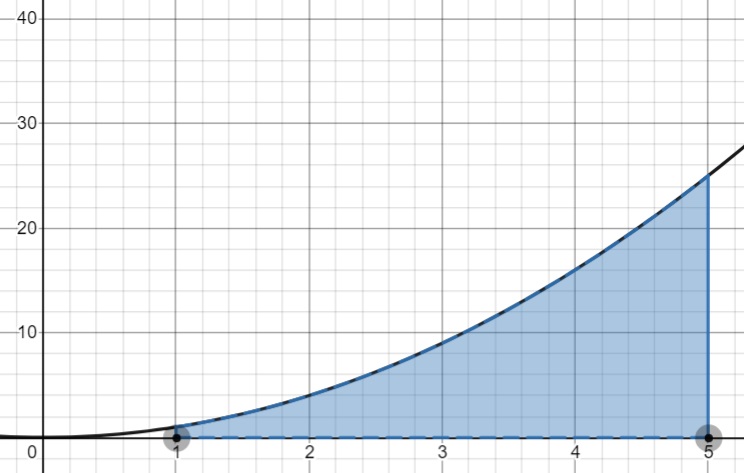
This confirms that we are dealing with a positive area, so we can use a straightforward integral:

Step 2: Calculate the definite integral. The Desmos calculator (Step 1) will give you a solution: 124/3 ≈ 41.333.
If you need the integration steps:
- Go to Symbolab’s Calculator.
- Click on the small grey box and type in 5 as an upper bound. Then click on the bottom box and type 1 as your lower bound (your “bounds of integration”.

- Type in your formula (for this example, that’s x2) between the integral symbol ∫ and “dx”. Then click the red “Go” button on the right.

Area Function Example 2: Below The X-Axis
Example question: What is the area between the x-axis and the function f(x) = x3 between x = -1 and x = 0?
Follow the exact same Steps in example 1.
However, remove the negative sign in front of the solution because the area must be positive
Solution:
Step 1: Graph the Area (using Desmos):
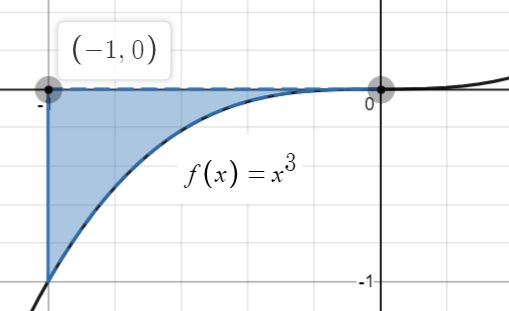
This confirms that we are dealing with a negative area under the x-axis. In other to get a positive value we have to put a negative sign in front of the integral:

In other words, you’re taking the negative of the integral solution (a negative is a positive).
The solution is 0.25.
Combination of Above and Below The X-Axis
If your graph has parts above and below the axis, like this graph of x3 for the interval [-1, 1]:
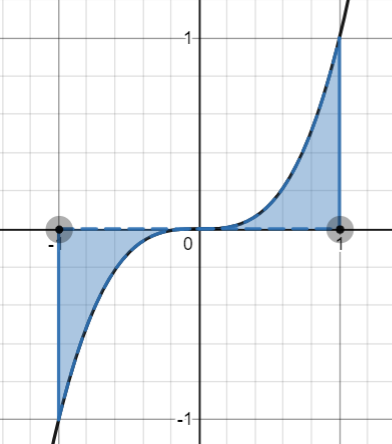
- Note the intervals where the graph is positive. For this example, the graph above (x3) is positive between [0, 1]. Calculate the area using the steps in example 1. You should get 0.25.
- Note the intervals where the graph is negative. For this example, the graph above (x3) is negative between [-1, 0]. Calculate the area using the steps in example 2. You should get 0.25.
- Add the two answers from (1) and (2) together. 0.25 + 0.25 – 0.50.
That’s it!
How to Find the Area Under Curve in Excel
Watch the video or read the steps below:
Microsoft Excel doesn’t have functions to calculate definite integrals, but you can approximate this area by dividing the curve into smaller curves, each resembling a line segment. Use the following steps to calculate the area under a curve in Excel as the total area of the trapezoids under these line segments:
How to Find the Area Under Curve in Microsoft Excel: Steps
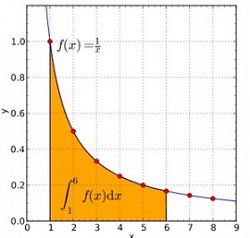
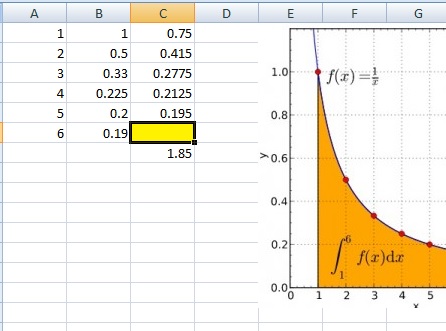
Example question: Find the area under curve in Excel for the graph below, from x = 1 to x = 6.
Step 1: Choose a few data points on the x-axis under the curve (use a formula, if you have one) and list these values in Column A in sequence, starting from Row 1. In this example from the graph on the left, your x-values are 1, 2, 3, 4, 5 and 6. Ensure that the first and last data points chosen on the curve are its starting and ending points respectively.
Step 2: List the corresponding y-axis data points in Column B, aligning them row-wise with the values in Column A. For this example, I’m going to assume that you don’t have the formula. In other words, I’m guessing where the values lie based on the graph. I’ll use y = 1, 0.5, 0.33, 0.225, 0.2 and 0.19.
Step 3: Type the following formula into cell C1
=(B1+B2)/2*(A2-A1)
and copy this for all Column C cells till the second-last row of data. To copy, click cell C1 and then click and drag the little black box in the right hand corner. In this example, you have 6 data points so you would drag the formula to cell C5.
Step 4: Calculate the sum of the totals in Column C. In this example, click cell C6 and then click the summation sign “Σ” on the ribbon. The solution will appear in cell C6.
Step 5: Delete the last row in column c (not the total!—see the image below). The correct approximation will not show in the summation cell.
For this example, the solution is 1.85.
That’s it!
Tip
When finding the area under curve in Excel, keep the x-axis increments as small as possible. This improves the curve’s approximation and the accuracy of the area under the curve. In other words, the more values you input into columns A and B, the more accurate your results will be. By using trapezoids of equal width, i.e. equidistant data points on the x-axis, you can do away with the first column; the formula in Column C is simply C1=(B1+B2)/2. The total sum of the values in Column C can then be multiplied by this constant width to give the total area under the curve.
Check out our YouTube channel for more help!
References
“Area under a curve” image created at Desmos.com.
