What is Simple Linear Regression?
How to Find a Linear Regression Equation:
- How to Find a Linear Regression Equation by Hand.
- Find a Linear Regression Equation in Excel.
- TI83 Linear Regression.
- TI 89 Linear Regression
Finding related items:
- How to Find the Regression Coefficient.
- Find the Linear Regression Slope.
- Find a Linear Regression Test Value.
Leverage:
What is Simple Linear Regression?
If you’re just beginning to learn about regression analysis, a simple linear is the first type of regression you’ll come across in a stats class.
Linear regression is the most widely used statistical technique; it is a way to model a relationship between two sets of variables. The result is a linear regression equation that can be used to make predictions about data.
Most software packages and calculators can calculate linear regression. For example:
You can also Find a linear regression by hand.
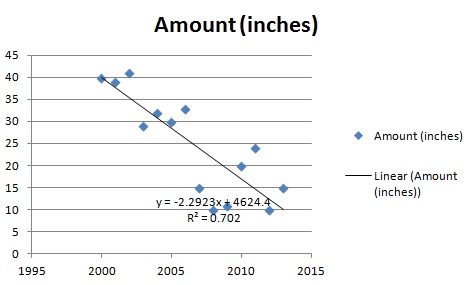
Before you try your calculations, you should always make a scatter plot to see if your data roughly fits a line. Why? Because regression will always give you an equation, and it may not make any sense if your data follows an exponential model. If you know the relationship is non-linear, but don’t know exactly what that relationship is, one solution is to use linear basis function models— which are popular in machine learning.
Etymology
“Linear” means line. The word Regression came from a 19th-Century Scientist, Sir Francis Galton, who coined the term “regression toward mediocrity” (in modern language, that’s regression to the mean. He used the term to describe the phenomenon of how nature tends to dampen excess physical traits from generation to generation (like extreme height).
Why use Linear Relationships?
Linear relationships, i.e. lines, are easier to work with and most phenomenon are naturally linearly related. If variables aren’t linearly related, then some math can transform that relationship into a linear one, so that it’s easier for the researcher (i.e. you) to understand.
What is Simple Linear Regression?
You’re probably familiar with plotting line graphs with one X axis and one Y axis. The X variable is sometimes called the independent variable and the Y variable is called the dependent variable. Simple linear regression plots one independent variable X against one dependent variable Y. Technically, in regression analysis, the independent variable is usually called the predictor variable and the dependent variable is called the criterion variable. However, many people just call them the independent and dependent variables. More advanced regression techniques (like multiple regression) use multiple independent variables.
Regression analysis can result in linear or nonlinear graphs. A linear regression is where the relationships between your variables can be described with a straight line. Non-linear regressions produce curved lines.(**)
Regression analysis is almost always performed by a computer program, as the equations are extremely time-consuming to perform by hand.
**As this is an introductory article, I kept it simple. But there’s actually an important technical difference between linear and nonlinear, that will become more important if you continue studying regression. For details, see the article on nonlinear regression.
Back to top
How to Find a Linear Regression Equation: Overview
Watch the video or read the steps below to find a linear regression equation by hand.

Can’t see the video? Click here to watch it on YouTube
Regression analysis is used to find equations that fit data. Once we have the regression equation, we can use the model to make predictions. One type of regression analysis is linear analysis. When a correlation coefficient shows that data is likely to be able to predict future outcomes and a scatter plot of the data appears to form a straight line, you can use simple linear regression to find a predictive function. If you recall from elementary algebra, the equation for a line is y = mx + b. This article shows you how to take data, calculate linear regression, and find the equation y’ = a + bx. Note: If you’re taking AP statistics, you may see the equation written as b0 + b1x, which is the same thing (you’re just using the variables b0 + b1 instead of a + b.
The Linear Regression Equation
Linear regression is a way to model the relationship between two variables. You might also recognize the equation as the slope formula. The equation has the form Y= a + bX, where Y is the dependent variable (that’s the variable that goes on the Y axis), X is the independent variable (i.e. it is plotted on the X axis), b is the slope of the line and a is the y-intercept.
The first step in finding a linear regression equation is to determine if there is a relationship between the two variables. This is often a judgment call for the researcher. You’ll also need a list of your data in x-y format (i.e. two columns of data—independent and dependent variables).
Warnings:
- Just because two variables are related, it does not mean that one causes the other. For example, although there is a relationship between high GRE scores and better performance in grad school, it doesn’t mean that high GRE scores cause good grad school performance.
- If you attempt to try and find a linear regression equation for a set of data (especially through an automated program like Excel or a TI-83), you will find one, but it does not necessarily mean the equation is a good fit for your data. One technique is to make a scatter plot first, to see if the data roughly fits a line before you try to find a linear regression equation.
How to Find a Linear Regression Equation: Steps
Step 1: Make a chart of your data, filling in the columns in the same way as you would fill in the chart if you were finding the Pearson’s Correlation Coefficient.
14399425718499801325791975625624155787495932497569
| Subject | Age x | Glucose Level y | xy | x2 | y2 |
|---|---|---|---|---|---|
| 2 | 21 | 65 | 1365 | 441 | 4225 |
| 4 | 42 | 75 | 3150 | 1764 | 5625 |
| 6 | 59 | 81 | 4779 | 3481 | 6561 |
| Σ | 247 | 486 | 20485 | 11409 | 40022 |
From the above table, Σx = 247, Σy = 486, Σxy = 20485, Σx2 = 11409, Σy2 = 40022. n is the sample size (6, in our case).
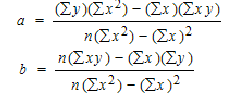
Step 2: Use the following equations to find a and b.
a = 65.1416
b = .385225
Find a:
- ((486 × 11,409) – ((247 × 20,485)) / 6 (11,409) – 2472)
- 484979 / 7445
- =65.14
Find b:
- (6(20,485) – (247 × 486)) / (6 (11409) – 2472)
- (122,910 – 120,042) / 68,454 – 2472
- 2,868 / 7,445
- = .385225
Step 3: Insert the values into the equation.
y’ = a + bx
y’ = 65.14 + .385225x
That’s how to find a linear regression equation by hand!
* Note that this example has a low correlation coefficient, and therefore wouldn’t be too good at predicting anything.
Back to top
Find a Linear Regression Equation in Excel
To learn more watch the video below or keep reading.
Can’t see the video? Click here to watch it on YouTube.
Linear Regression Equation Microsoft Excel: Steps
Step 1: Install the Data Analysis Toolpak, if it isn’t already installed. For instructions on how to load the Data Analysis Toolpak, click here.
Step 2: Type your data into two columns in Excel. For example, type your “x” data into column A and your “y” data into column b. Do not leave any blank cells between your entries.
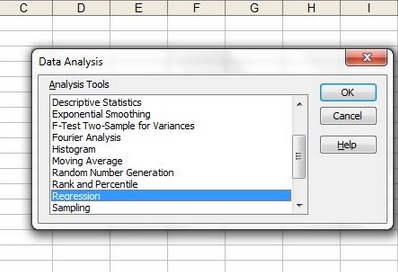
Step 3: Click the “Data Analysis” tab on the Excel toolbar.
Step 4: Click “regression” in the pop up window and then click “OK.”
Step 5: Select your input Y range. You can do this two ways: either select the data in the worksheet or type the location of your data into the “Input Y Range box.” For example, if your Y data is in A2 through A10 then type “A2:A10” into the Input Y Range box.
Step 6: Select your input X range by selecting the data in the worksheet or typing the location of your data into the “Input X Range box.”
Step 7: Select the location where you want your output range to go by selecting a blank area in the worksheet or typing the location of where you want your data to go in the “Output Range” box.
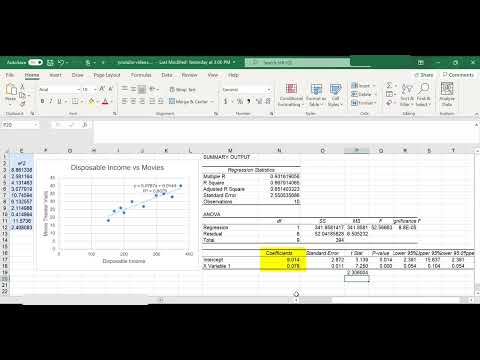
Step 8: Click “OK”. Excel will calculate the linear regression and populate your worksheet with the results.
Tip: The linear regression equation information is given in the last output set (the coefficients column). The first entry in the “Intercept” row is “a” (the y-intercept) and the first entry in the “X” column is “b” (the slope).
TI83 Linear Regression
TI 83 Linear Regression: Overview
Watch the video for a guide on linear regression on the TI-83, or read on below.

Can’t see the video? Click here to watch it on YouTube.
Linear regression is tedious and prone to errors when done by hand, but you can perform linear regression in the time it takes you to input a few variables into a list. Linear regression will only give you a reasonable result if your data looks like a line on a scatter plot, so before you find the equation for a linear regression line you may want to view the data on a scatter plot first. See this article for how to make a scatter plot on the TI 83.
TI 83 Linear Regression: Steps
Sample problem: Find a linear regression equation (of the form y = ax + b) for x-values of 1, 2, 3, 4, 5 and y-values of 3, 9, 27, 64, and 102.
Step 1: Press STAT, then press ENTER to enter the lists screen. If you already have data in L1 or L2, clear the data: move the cursor onto L1, press CLEAR and then ENTER. Repeat for L2.
Step 2: Enter your x-variables, one at a time. Follow each number by pressing the ENTER key. For our list, you would enter:
1 ENTER
2 ENTER
3 ENTER
4 ENTER
5 ENTER
Step 3: Use the arrow keys to scroll across to the next column, L2.
Step 4: Enter your y-variables, one at a time. Follow each number by pressing the enter key. For our list, you would enter:
3 ENTER
9 ENTER
27 ENTER
64 ENTER
102 ENTER
Step 5: Press the STAT button, then use the scroll key to highlight “CALC.”
Step 6: Press 4 to choose “LinReg(ax+b)”. Press ENTER and then ENTER again. The TI 83 will return the variables needed for the equation. Just insert the given variables (a, b) into the equation for linear regression (y=ax+b). For the above data, this is y = 25.3x – 34.9.
That’s how to perform TI 83 Linear Regression!
How to Find a Linear Regression Slope: Overview
Remember from algebra, that the slope is the “m” in the formula y = mx + b.
In the linear regression formula, the slope is the a in the equation y’ = b + ax.
They are basically the same thing. So if you’re asked to find linear regression slope, all you need to do is find b in the same way that you would find m.
Calculating linear regression by hand is tricky, to say the least. There’s a lot of summation (that’s the Σ symbol, which means to add up). The basic steps are below, or you can watch the video at the beginning of this article. The video goes into a lot more detail about how to do summation. Finding the equation will also give you the slope. If you don’t want to find the slope by hand (or if you want to check your work), you can also use Excel.
How to Find Linear Regression Slope: Steps
Step 1: Find the following data from the information given: Σx, Σy, Σxy, Σx2, Σy2. If you don’t remember how to get those variables from data, see this article on how to find a Pearson’s correlation coefficient. Follow the steps there to create a table and find Σx, Σy, Σxy, Σx2, and Σy2.
Step 2: Insert the data into the b formula (there is no need to find a).
If formulas scare you, you can find more comprehensive instructions on how to work the formula here: How to Find a Linear Regression Equation: Overview.
How to Find Regression Slope in Excel 2013
Subscribe to our Youtube channel for lots more stats tips and tricks.
How to Find the Regression Coefficient
A regression coefficient is the same thing as the slope of the line of the regression equation. The equation for the regression coefficient that you’ll find on the AP Statistics test is: B1 = b1 = Σ [ (xi – x)(yi – y) ] / Σ [ (xi – x)2]. “y” in this equation is the mean of y and “x” is the mean of x.
 You could find the regression coefficient by hand (as outlined in the section at the top of this page).
However, you won’t have to calculate the regression coefficient by hand in the AP test — you’ll use your TI-83 calculator. Why? Calculating linear regression by hand is very time consuming (allow yourself about 30 minutes to do the calculations and check them) and because of the huge number of calculations you have to make you’re very likely to make mathematical errors. When you find a linear regression equation on the TI83, you get the regression coefficient as part of the answer.
Sample problem: Find the regression coefficient for the following set of data:
x: 1, 2, 3, 4, 5.
y: 3, 9, 27, 64, 102.
Step 1: Press STAT, then press ENTER to enter LISTS. You may need to clear data if you already have numbers in L1 or L2. To clear the data: move the cursor onto L1, press CLEAR and then ENTER. Repeat for L2 if you need to.
Step 2: Enter your x-data into a list. Press the ENTER key after each entry.
1 ENTER
2 ENTER
3 ENTER
4 ENTER
5 ENTER
Step 3: Scroll across to the next column, L2 using the arrow keys at the top right of the keypad.
Step 4: Enter the y-data:
3 ENTER
9 ENTER
27 ENTER
64 ENTER
102 ENTER
Step 5: Press the STAT button, then scroll to highlight “CALC.” Press ENTER
Step 6: Press 4 to choose “LinReg(ax+b)”. Press ENTER. The TI 83 will return the variables needed for the linear regression equation. The value you’re looking for >the regression coefficient > is b, which is 25.3 for this set of data.
That’s it!
Back to top
Linear Regression Test Value
Linear regression test values are used in simple linear regression exactly the same way as test values (like the z-score or T statistic) are used in hypothesis testing. Instead of working with the z-table you’ll be working with a t-distribution table. The linear regression test value is compared to the test statistic to help you support or reject a null hypothesis.
Linear Regression Test Value: Steps
Sample question: Given a set of data with sample size 8 and r = 0.454, find the linear regression test value.
Note: r is the correlation coefficient.
Step 1: Find r, the correlation coefficient, unless it has already been given to you in the question. In this case, r is given (r = .0454). Not sure how to find r? See: Correlation Coefficient for steps on how to find r.
Step 2: Use the following formula to compute the test value (n is the sample size):

How to solve the formula:
- Replace the variables with your numbers:
T = .454√((8 – 2)/(1-[.454]2 ))- Subtract 2 from n:
8 – 2 = 6 - Square r:
.454 × .454 = .206116 - Subtract step (3) from 1:
1 – .206116 = .793884 - Divide step (2) by step (4):
6 / .793884 = 7.557779 - Take the square root of step (5):
√7.557779 = 2.74914154 - Multiply r by step (6):
.454 × 2.74914154 = 1.24811026
- Subtract 2 from n:
The Linear Regression Test value, T = 1.24811026
That’s it!
Finding the test statistic
The linear regression test value isn’t much use unless you have something to compare it to. Compare your value to the test statistic. The test statistic is also a t-score (t) defined by the following equation:
t = slope of the sample regression line / standard error of the slope.
See: How to find a linear regression slope / How to find the standard error of the slope (TI-83).
You can find a worked example of calculating the linear regression test value (with an alpha level) here: Correlation Coefficients.
Leverage in Linear Regression
Data points that have leverage have the potential to move a linear regression line. They tend to be outliers. An outlier is a point that is either an extremely high or extremely low value.
Influential Points
If the parameter estimates (sample standard deviation, variance etc.) change significantly when an outlier is removed, that data point is called an influential observation.
The more a data point differs from the mean of the other x-values, the more leverage it has. The more leverage a point is, the higher the probability that point will be influential (i.e. it could change the parameter estimates).
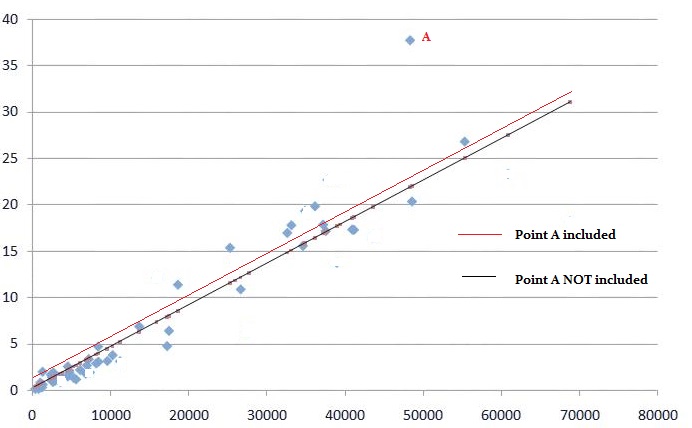
Leverage in Linear Regression: How it Affects Graphs
In linear regression, the influential point (outlier) will try to pull the linear regression line toward itself. The graph below shows what happens to a linear regression line when outlier A is included:
Outliers with extreme X values (values that aren’t within the range of the other data points) have more leverage in linear regression than points with less extreme x values. In other words, extreme x-value outliers will move the line more than less extreme values.
The following graph shows a data point outside of the range of the other values. The values range from 0 to about 70,000. This one point has an x-value of about 80,000 which is outside the range. It affects the regression line a lot more than the point in the first image above, which was inside the range of the other values.
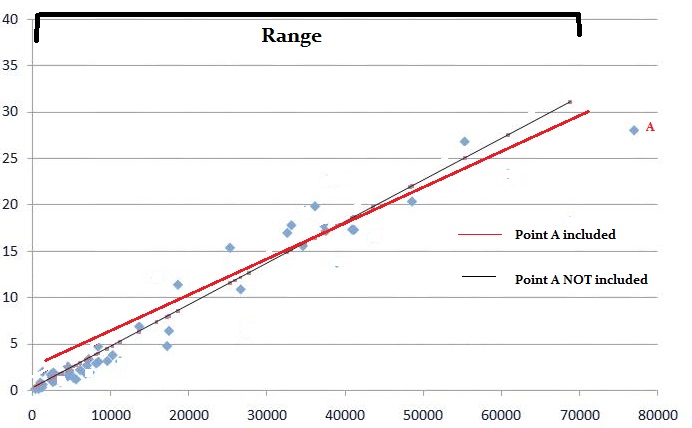
In general, outliers that have values close to the mean of x will have less leverage that outliers towards the edges of the range. Outliers with values of x outside of the range will have more leverage. Values that are extreme on the y-axis (compared to the other values) will have more influence than values closer to the other y-values.
Like the videos? Subscribe to our Youtube Channel.
Connection to Affine Transformation
Linear regression is infinitely connected to affine transformation. The formula y′ = b + ax isn’t really linear…it’s an affine function, which is defined as a linear function plus a transformation. So it should really be called affine regression, not linear!
References
Edwards, A. L. An Introduction to Linear Regression and Correlation. San Francisco, CA: W. H. Freeman, 1976.
Edwards, A. L. Multiple Regression and the Analysis of Variance and Covariance. San Francisco, CA: W. H. Freeman, 1979.