Influential data consists of data points that influence (skew) an analysis in a major way. They are outliers that have enough clout to significantly change a regression line or statistical coefficients; removing them leads an analysis to a different conclusion.
Properties of Influential Data
An influential data point has two key properties:
- It has properties that are not representative of the other data points. It doesn’t follow the general trend, and it’s dependent variable value is unexpected given values you would get from predictor variables.
- It has leverage— the ability to move a regression line towards itself.
Identifying influential data is important because regression analysis isn’t resistant to influential outliers; one wrong measurement has the potential to completely throw an analysis off. Since all of data sampling is prone to human error, it’s important to be open to the possibility that not all of our data points may be entirely valid.
Two formulas can help identify influential data points in a data set: Cook’s D and DFFits.
Cook’s D
This formula is given by:
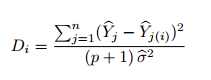
Cook’s D has more than one interpretation, so can be tricky to use. For more details, see: What is Cook’s D?
Distance of Fits formula (DFFits)
DFFits is written as:
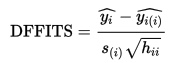
si is an estimation of the standard error of the regression slope, hii is the leverage for the point, and ŷi and ŷi(i) are response predictions with and without the point included in the regression.
The first part of the formula represents the predicted data responses without the point being analyzed, and the second term represents with. You are essentially finding out how much difference that point makes. The denominator actually represents the estimated standard deviation of the change in predicted responses.
That means the number the DFFITS formula give us is the number of standard deviations your response variable changes when your point of interest is admitted.
If DFFITS for a data point is more than
![]()
that point can be classified as influential data.
Either one of the above methods of flagging influential data can be used; in general, it is recommended to go with whatever is easier to run in the software package you are using for data analysis.
References
O’Halloran, S. (n.d.). Model Checking. Retrieved Dec 30, 2017 from http://www.columbia.edu/~so33/SusDev/Lecture_5.pdf
Penn State (2017). Regression Methods: Identifying Influential Data Points
Retrieved Dec 31, 2017 from https://onlinecourses.science.psu.edu/stat501/node/340
Sampson, P. (2010). Stat 423: Unusual and Influential Data
Retrieved December 30, 2017 from http://www.stat.washington.edu/pds/stat423/Documents/LectureNotes/notes.423.ch11.pdf.