< List of probability distributions < Elliptical distribution
Contents:
What is an elliptical distribution?
An elliptical distribution specifies the density of a vector of variables with an elliptical contour. It is also called a multivariate elliptical distribution because it involves multiple variables (dimensions).
An elliptical distribution with density function f is defined as [1]
where
- k = a normalizing constant,
- x = an n-dimensional random vector with median (or mean) vector µ,
- Σ = a positive definite matrix proportional to the covariance matric (if that exists).
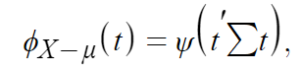
The distribution can also be defined in terms of its characteristic function:
“A random vector X = (X1,…,Xd) has an elliptical distribution if there exists μ ∈ ℝd and a positive semi-definite matrix Σ such that the characteristic function of X is of the form t ↦ φ(tT Σt) exp(iμTt) for some φ : [0, ∞) → ℝ. We write X ∼ E(μ, Σ) making φ in this notation implicit.”
Rossell and Zwiernik [2].
The family of elliptical distributions includes the multivariate normal distribution, t-distribution, and multivariate logistic distribution. Although these distributions have different probability densities, they all share certain properties related to their shape such as symmetry, ellipsoidal contours, and constant density along ellipsoidal contours.
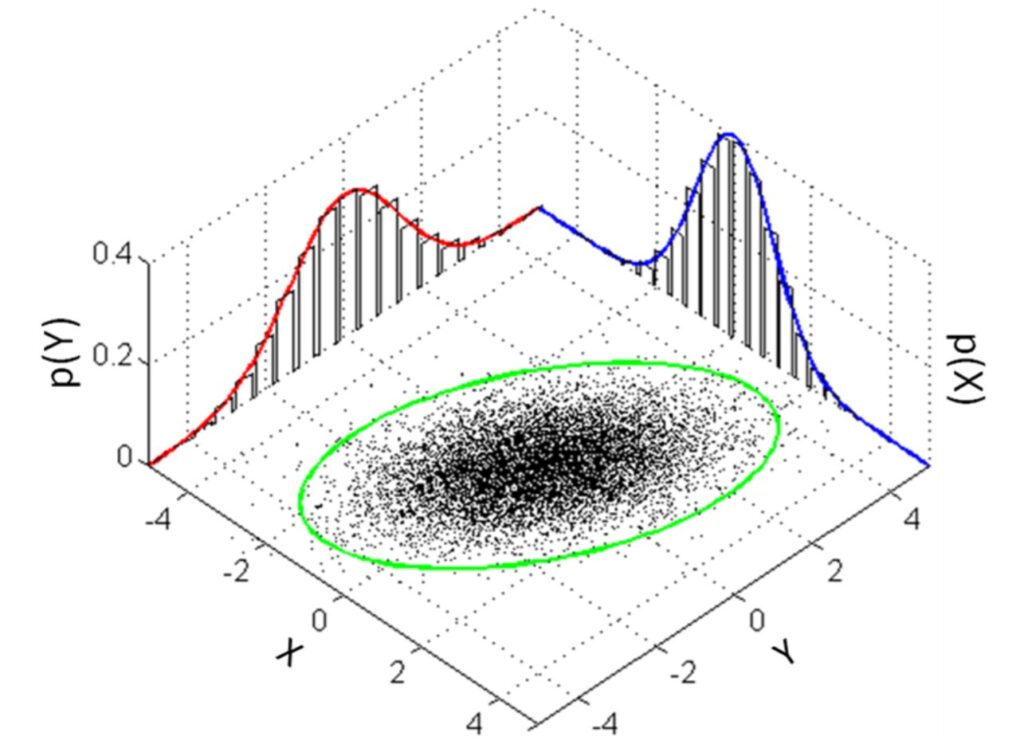
About elliptical contours
An elliptical contour is formed by drawing an ellipse which encompasses the PDF at a certain point. In other words, contours are a graphical way to represent probability densities; the points on the contour have the same density under the elliptic distribution.
![Flattened and tilted elliptical contours [3].](https://www.statisticshowto.com/wp-content/uploads/2023/10/mvn-contour.png)
The contour lines of an elliptical distribution are created by plotting a set of points with the same density value. These lines can be represented by ellipses centered at the mean of the distribution and spreading out to different standard deviations. The shape and size of the elliptical contour can also be used to identify the underlying distribution of data as well as for modeling, statistical inference and predictions.
Elliptical distributions and the Mahalanobis distance
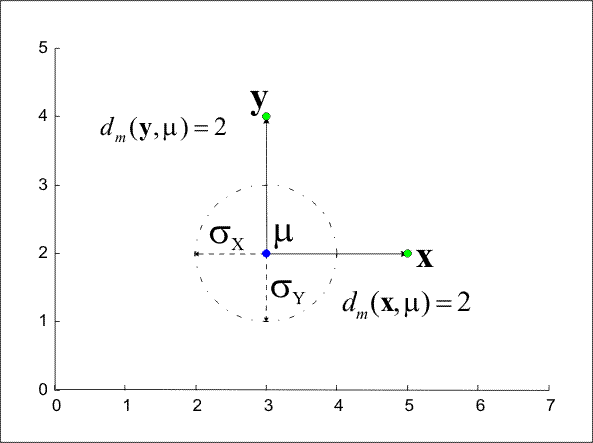
Elliptical distributions are characterized by the Mahalanobis distance, which describes the distance between a data point and the center of the distribution, taking into account the covariance structure of the data. The covariance structure of an elliptical distribution is a description of how the variables are correlated. It is represented by a covariance matrix — a square matrix where each entry represents the covariance between two variables.
The Mahalanobis distance can be used to estimate similarity between variables.
One expression for the Mahalanobis distance is [5]:
Where:
- xA and xB is a pair of objects, and
- C is the sample covariance matrix.
In the case of the multivariate normal distribution, the value of the PDF at point x depends only on the Mahalanobis distance from location μ via the dispersion σ (i.e., the standard deviation).
Semi-elliptical distribution
The semi-elliptical distribution (also called Wigner’s semicircle distribution) is named for its characteristic semi-elliptical density function. It is different from the elliptical distribution in several ways:
- The semi-elliptical is a univariate distribution that models in a single dimension, while the elliptical distribution is a multivariate distribution that models dependence between multiple variables.
- The semi-elliptical distribution is not symmetric, while the elliptical distribution is symmetric around its center.
- The density function of the semi-elliptical is concave for small values and convex for large values.
- The semi-elliptical distribution has a finite range, while the elliptical distribution does not have this restriction.
References
[1] Cambanis, Stamatis; Huang, Steel; Simons, Gordon (1981). “On the theory of elliptically contoured distributions”. Journal of Multivariate Analysis. 11 (3): 368–385. doi:10.1016/0047-259x(81)90082-8.
[2] Liang, P. (2017). The Nonparametric Estimation Of Elliptical Distributions. Thesis, retrieved October 16, 2023 from: https://scholarworks.utep.edu/cgi/viewcontent.cgi?article=1480&context=open_etd
[3] Day 39 – Multivariate outliers
[4] Piotrg at pl.wikipedia, CC BY-SA 3.0 http://creativecommons.org/licenses/by-sa/3.0/, via Wikimedia Commons
[5] Varmuza, K. & Filzmoser, P. Introduction to Multivariate Statistical Analysis in Chemometrics. CRC Press