Statistics Definitions > Decile
Deciles break up a set of data into tenths. They are similar to quartiles. But while quartiles sort data into four quarters, data is instead sorted into ten equal parts: The 10th, 20th, 30th, 40th, 50th, 60th, 70th, 80th, 90th and 100th percentiles.
Watch the video for an overview:
A decile rank assigns a number to each tenth:
| Decile Rank | Percentile |
| 1 | 10th |
| 2 | 20th |
| 3 | 30th |
| 4 | 40th |
| 5 | 50th |
| 6 | 60th |
| 7 | 70th |
| 8 | 80th |
| 9 | 90th |
The higher your place in the above rankings, the higher your overall ranking. For example, if you were in the 99th percentile for a particular test, that would put you in a ranking of 10. However, if you scored very low (say, the 5th percentile), then you would have a rank of 1.

Why are Decile ranks used instead of percentiles of quartiles?
Basically, ranks are just another way to categorize data and which system you use is usually a judgment call. For example, if you wanted to display class rankings on a pie chart, using deciles would make more sense that percentiles. That’s because a pie chart with 10-categories would be much easier to read than a pie chart with 99 categories.
What is a Decile used for in Real Life?
They are used significantly more often in real life than in the classroom. For example, Australia [1] uses decile ranks to report drought data. Ranks of 1-2 represent the lowest 20% (“much below normal”). That means droughts that are “much below normal” don’t occur more than 20% of the time.
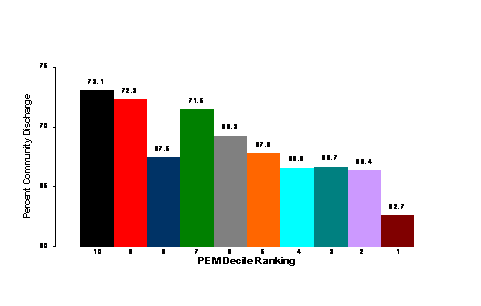
They are also commonly used for college admissions and high school rankings. For example, this chart from Roanoke College shows the high school rankings for the student body.
Next: Interdecile Range
References
[1] Retrieved January 1, 2022 from: http://drought.unl.edu/Planning/Monitoring/ComparisonofIndicesIntro/Deciles.aspx