Statistics Definitions > What is a Dot Plot
Dot Plot: Definition
A Dot Plot, also called a dot chart or strip plot, is a type of simple histogram-like chart used in statistics for relatively small data sets where values fall into a number of discrete bins (categories). A dot plot is similar to a bar graph because the height of each “bar” of dots is equal to the number of items in a particular category. To draw one, count the number of data points falling in each bin (What is a BIN in statistics?) and draw a stack of dots that number high for each bin.
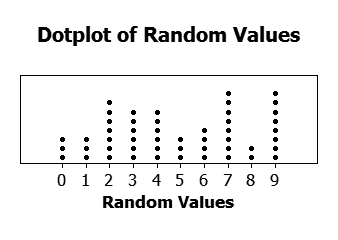
A dot plot is a graphical display of data using dots. A good example would be the choice of foods that you and your friends ate for snacks. The illustration below shows a plot for a random sample of integers.
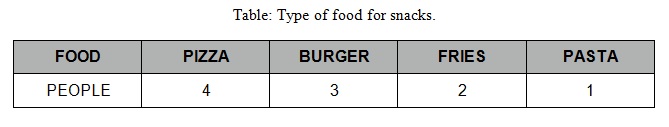
In a table chart it looks like this:
With dots, it looks like this:
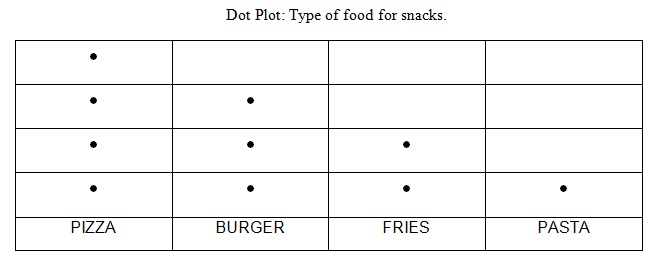
To analyze this chart, the idea is that there are four of you eating snacks together. The choices for the snacks are: pizza, burger, fries and pasta. With the Dot Plot, it indicates that all of you have chosen pizza. In addition, three others in your group added a burger to their snack plate. This chart goes on to identify that two people in your group have added fries, and one in your group has added pasta to his or her meal.
The dots don’t have to be in a largest to highest order though. They can also be in a random order, like this next dotplot shows:
In Summary
In summary, a Dot Plot is a graph for displaying the distribution of quantitative variable where each dot represents a value. For whole numbers, if a value occurs more than once, the dots are placed one above the other so that the height of the column of dots represents the frequency for that value.
Note: Dot plots aren’t the same as Scatter plots: they are more like a histogram as it sorts data into BINs. You can create dot plots with software like SPSS.
References
Gonick, L. (1993). The Cartoon Guide to Statistics. HarperPerennial.
Vogt, W.P. (2005). Dictionary of Statistics & Methodology: A Nontechnical Guide for the Social Sciences. SAGE.