The Brunner Munzel test (also called the Generalized Wilcoxon Test) is a non parametric statistical test for stochastic equality of two samples. Stochastic equality is a similarity measure between two populations, which means that the populations have roughly the same frequency of greater values.
The BM test isn’t widely available in statistical software. There are a few R and SAS macros, but they tend to give inconsistent results (LaBone et al., 2013).
When to Use the Brunner Munzel Test
This heteroskedasticity–robust test can be used as an alternative to the Wilcoxon-Mann-Whitney (WMW) rank sum test (Fagerland, 2012). The BM test allows ties and adjusts for unequal variances, so—unlike the Mann Whitney test—it doesn’t require the assumption of equal variances between two groups.
the BM test performs well for tied values, ordered categorical data and can be used for both continuous and discrete distributions (LaBone, 2013). It is an approximately valid test of a weak null hypothesis for large enough samples (Lin, 2013).
Like most non parametric tests, the Brunner Munzel test is most suited to small samples. The test requires at least ten observations per group to apply small sample approximation with the t-distribution and performs well for sample sizes of 30 or more (Neuhauser, 2011). If the sample size is under 10, the permuted BM test is a better option.
BM Test Statistic
The null hypothesis for the test is H0 = 0.5, which implies stochastic equality. The alternate hypothesis is H0 ≠ 0.5, which means that greater values occur in one of the groups. If the null hypothesis is rejected, it should be interpreted rather vaguely as meaning that the populations differ in some way.
The Brunner Munzel test statistic is calculated with the formula (LaBone, 2013)
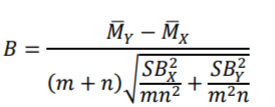
Where:
- Mx and My are the means of the midranks for samples X and Y,
- m, n are the number of observations in the two samples,
- SB are the variance estimates for X and Y.
Brunner and Munzel suggest using a t-distribution with a Welch–Satterthwaite approximation for degrees of freedom.
References
Brunner, E., and Munzel, U. (2000), “The Nonparametric Behrens-Fisher Problem: Asymptotic Theory and a Small-Sample Approximation,” Biometrical Journal, 42, 17-25
Fagerland, M. (2012). t-tests, non-parametric tests, and large studies—a paradox of statistical practice? d BMC Medical Research Methodology 2012, 12:78
http://www.biomedcentral.com/1471-2288/12/78
LaBone et al. (2013). Response to SC&A Comments on ORAUT-RPRT-0053. Retrieved January 25, 2021 from: https://www.cdc.gov/niosh/ocas/pdfs/dps/dc-orrprt53-r0.pdf
Lin, W. (2013). Essays on Causal Inference in Randomized Experiments. Retrieved January 25, 2021 from: https://www.stat.yale.edu/~wl389/winston-thesis.pdf
Neuhauser, M. (2011). Nonparametric Statistical Tests A Computational Approach. CRC Press.