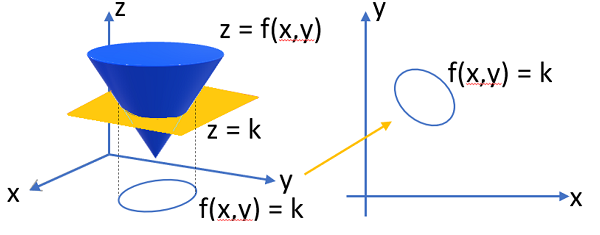
A level curve of a function f(x, y) is a cross section of a three-dimensional figure, projected onto an x-y plane.
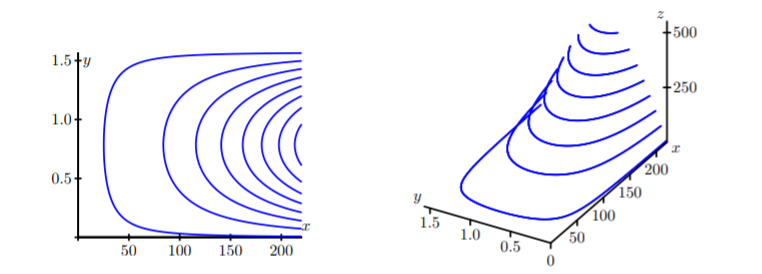
Level curves tell us something about heights on a landscape; they are used to create three-dimensional surfaces from two-dimensional contours. For example, the following image shows several level curves and what these curves look like when they are “lifted” and plotted at their respective heights [1]:

We can find a level curve in the plane with the formula f(x, y) = c for some fixed number c [2]. For graphs of three variable functions w = f(x, y, z), the level curves are f(x, y, z) = k[3].
Level Curve of a Function and Contour Maps

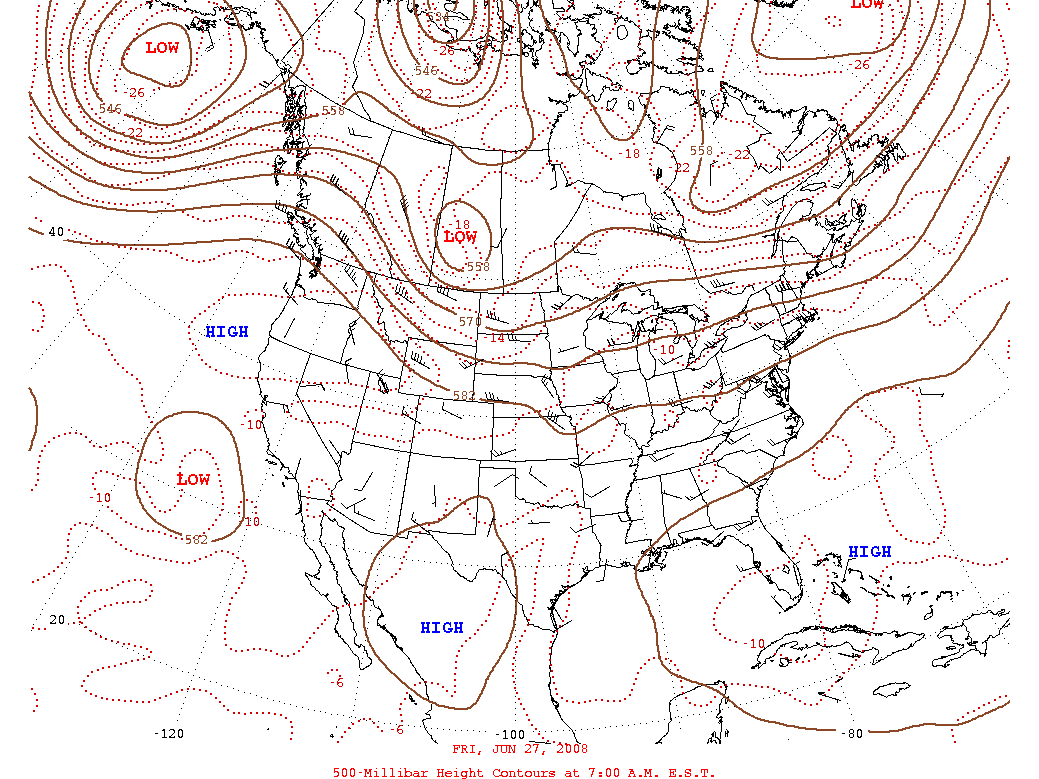
Level curves are identical to contour lines on a map; points on the same curve or line have a constant altitude (i.e., equal height) on the map with respect to the function. A level curve is the set of all points of one cross section, but if we take several cross sections of a three-dimensional shape, we create a contour map.
If f(x, y) represents altitude at point (x, y), then each contour can be described by f(x, y) = k, where k is a constant. They are created by finding the intersections of function values (or planes at a certain heights) with the graph of the function. The intersections are then plotted in the plane.

Note: If a level curve of a function intersects itself at a nonzero angle at a point (x,y) then (x,y) is a critical point [4].
References
[1] Multivariable and Vector Functions [PDF]. Retrieved January 25, 2022 from: https://scholarworks.gvsu.edu/cgi/viewcontent.cgi?filename=1&article=1014&context=books&type=additional
[2] Croke, C. Functions of several variables.
[3] Functions of two or more variables. Retrieved January 25, 2022 from: https://lindagreen.web.unc.edu/wp-content/uploads/sites/5262/2020/08/courseNotes_math233_2019F_Part3_FnsOfSeveralVariables.pdf
[4] Knill, O. Mathematics Maths 21a Summer 2004 Multivariable Calculus. Retrieved January 25, 2022 from: https://people.math.harvard.edu/~knill/teaching/summer2004/quiz2.html