Statistics Definitions > Pearson Mode Skewness
Pearson mode skewness, also called Pearson’s first coefficient of skewness, is a way to figure out the skewness of a distribution.
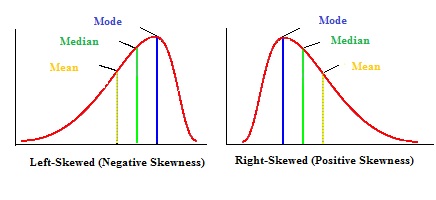
The mean, mode and median can be used to figure out if you have a positively or negatively skewed distribution.
- If the mean is greater than the mode, the distribution is positively skewed.
- If the mean is less than the mode, the distribution is negatively skewed.
- If the mean is greater than the median, the distribution is positively skewed.
- If the mean is less than the median, the distribution is negatively skewed.
Pearson Mode skewness
Pearson mode skewness uses the above facts to help you find out if you have positive or negative skewness. If you have a distribution and you know the mean, mode, and standard deviation (σ), then the Pearson mode skewness formula is:
(mean-mode)/σ
Sample problem: You have data with a mean of 19, a mode of 20 and a standard deviation of 25. What does Pearson Mode Skewness tell you about the distribution?
(mean-mode)/σ = (19-20)/25 = -0.04.
There is a very slight negative skewness (-0.04). Note: For most intents and purposes, this would count as a symmetric distribution as the skewness is so small.
Pearson Mode Skewness: Alternative Formula.
If you don’t know the mode, you won’t be able to use Pearson mode skewness. However, the direction of skewness can be also figured out by finding where the mean and the median are. According to Business Statistics, this leads to a second, equivalent formula:
3(Mean – Median) / σ
This formula is also called Pearson’s second coefficient of skewness.
Pearson Mode Skewness: What the Results mean.
The difference between the mean and mode, or mean and median, will tell you how far the distribution departs from symmetry. A symmetric distribution (for example, the normal distribution) has a skewness of zero.
Both equations give you results in standard deviations, which are dimensionless units of measurement from the mean.
References
Dodge, Y. (2008). The Concise Encyclopedia of Statistics. Springer.
Gonick, L. (1993). The Cartoon Guide to Statistics. HarperPerennial.
Klein, G. (2013). The Cartoon Introduction to Statistics. Hill & Wamg.
Vogt, W.P. (2005). Dictionary of Statistics & Methodology: A Nontechnical Guide for the Social Sciences. SAGE.