Non Parametric Data and Tests > Mood’s Median test
What is Mood’s Median Test?
Mood’s median test is used to compare the medians for two samples to find out if they are different. For example, you might want to compare the median number of positive calls to a hotline vs. the median number of negative comment calls to find out if you’re getting significantly more negative comments than positive comments (or vice versa).
This test is the nonparametric alternative to a one way ANOVA; Nonparametric means that you don’t have to know what distribution your sample came from (i.e. a normal distribution) before running the test. That said, your samples should have been drawn from distributions with the same shape. This test has very low statistical power for samples drawn from normal distributions or short-tailed distributions.
Use this test instead of the sign test when you have two independent samples.
- The null hypothesis for this test is that the medians are the same for both groups.
- The alternate hypothesis for the test is that the medians are different for both groups.
Running the Test
This test is normally run using statistical software. However, you can run the test by hand using the following steps:
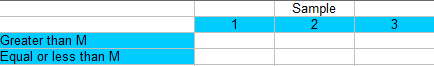
Step 1: Make a 2 x k contingency table, where k is the number of samples. For this example, let’s say there are 3 samples, making a 2 x 3 table. Fill in the table as shown.
 .
.
Step 2: Find M, the overall median for all the data in your samples. To do this, list all of your data (from all samples) in a single set. Sort in ascending order and then find the middle number.
Step 3: List each individual sample’s data in ascending order. Count how many data points are greater than M (from Step 2) and then count how many data points are smaller than or equal to M. List these in the first row of the contingency table.
Step 4: Perform a chi-square test on the completed contingency table.
Step 5: Compare the chi-square statistic to the table value with: degrees of freedom = (number of rows – 1) * (number of columns – 1). For this example, df = (2 – 1) * (3 – 1) = 1 * 2 = 2.
Results for The Test
Like most hypothesis tests, your results will include a p-value and an alpha level (usually 5% or 0.05).
If your p-value is less than or equal to alpha, the medians are different and you can reject the null hypothesis that they are the same.
Reference:
Robert Stephenson. Mood’s Median Test. Retrieved 8/20/2016 from here.