Statistics Definitions > Survival Analysis
Contents:
- What is Survival Analysis?
- The Survival Distribution / Survival Function
- What is Kaplan Meier Analysis?
What is Survival Analysis?
Survival analysis is a model for time until a certain “event.” The event is sometimes, but not always, death. For example, you can use survival analysis to model many different events, including:
- Time the average person lives, from birth.
- Time after cancer treatment until death.
- Time from first heart attack to the second.
- Time from HIV diagnosis to AIDS development.
- Time from manufacture of a component to component failure.
Survival time can be measured in years, months, days, or even fractions of a second. As well as estimating the time it takes to reach a certain event, survival analysis can also be used to compare time-to-event for multiple groups. For example, two production lines for light bulbs could be compared to see if there is a difference in lifetimes. In medicine, two groups with different attributes (like normal/overweight, diabetic/non-diabetic, high/low cholesterol) could be compared to see how those factors contribute to survival time in patients with heart disease, cancer or other diagnosis.
Survival analysis is used to compare groups when time is an important factor. Other tests, like the independent samples t-test or simple linear regression, can compare groups but those methods do not factor in time. In addition, survival times are usually positive numbers; many other methods would have to transform data in some way in order to maintain positive numbers.
Censoring
Typically, survival data isn’t completely observed. Instead, some of the data is censored. Censoring refers to missing data in a study such as subjects dropping out of trials or data that is otherwise lost. These are called “right censored” subjects. They are usually counted as alive (or disease free) for the duration of the study for purposes of data analysis. Another type of censoring happens when a subject simply doesn’t experience the event in question during the study. It doesn’t necessarily mean that the patient will never experience the event, just that the event didn’t happen under observation. In other words, the time to event is incomplete.
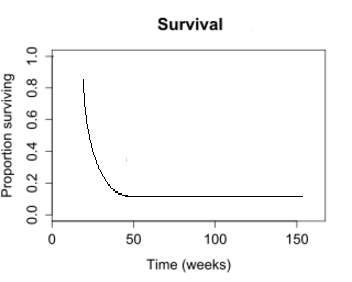
The Survival Distribution / Survival Function
A survival distribution is the probability distribution of a survival function; a function which tells us how long before a process terminates, fails, or comes to an expected end. One example of a popular survival distribution is the Weibull distribution.
Survival functions are important in many fields. We use them when researching survival times of patients in drug trials or similar studies, but they aren’t limited to strictly ‘survival’ situations. They can be used to model the time between job changes, the length of time people stay in a given house or city, the intervals between live births of African cheetahs, or the lifetime of a forest mushroom. This makes them an important part of social studies, natural history, and in almost every field of statistical research.
The Exponential Survival Distribution
One simple example of a frequently used survival distribution is the exponential distribution. Let h(t) be the hazard function, and S(T) the survival function. The hazard function is constant over time.
h(t)= λ
S(T)= e-λt
The survival distribution, is given by the product of these, so
f(t)= λ e-λt for λ > 0.
One interesting property of the exponential survival distribution is its ‘lack of memory’; If a probability distribution has the memoryless property the likelihood of something happening in the future has no relation to whether or not it has happened in the past. In other words, the history of the function is irrelevant to the future. This is a feature of certain hardware failures, and makes the exponential survival distribution useful in modeling the amount of time you have till your computer gives up the ghost or your hard drive stops powering on.
Defining an End in Survival Analysis
Before calculating survival functions and survival distributions, it’s important you define exactly what consists of the end event (‘failure’, ‘death’, ‘job change’, or whatever it might be) in your scheme of things. You’ll need to define this moment as concrete and specific. For instance, if your failure demonstrates slow deterioration rather than a sudden and abrupt end, you will need to decide exactly what point in the deterioration is significant. Would it make sense to define failure as deterioration to 25% functionality? What about 5 %? 1 %? 0.001?. It is your call, but make your decision before plugging numbers.
Sometimes it is impossible to define an exact end, and arbitrarily assigning one makes your research pointless. In these cases you will have to use recurring event or repeated event models.
What is Kaplan Meier Analysis?
Kaplan–Meier analysis measures the survival time from a certain date to time of death, failure or other significant event. For example, it can be used to calculate:
- How long people remain unemployed after a job loss.
- How long it takes for couples undergoing fertility treatment to get pregnant.
- Time-to-failure of machine parts.
In medicine, Kaplan Meier Analysis is the simplest way to calculate survival time after treatment.
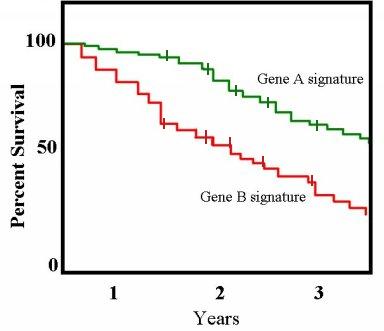 A graph of the Kaplan Meier estimator is a series of decreasing horizontal steps, which approaches the true survival function for that population given a large enough sample size. This graph shows two groups of patients: one with gene profile A and one with gene profile B. People with gene B die at a faster rate than those with gene A.
Complicating Factors
If every study participant is followed for the same length of time until their death, calculating the survival time is as easy as figuring out the fraction of surviving participants at any point in time. However, in the real world, complicating factors often make this task impossible. For example, calculating survival time can become complicated in clinical trials with factors like:
- Patients that drop out of the study either on purpose or because they lose touch with the researcher.
- Patients who are still alive at the end of the study, but who are expected to die (or do die) at a later date.
- Patients who enter the study at a later date than other patients.
Kaplan Meier Analysis is an effective tool for calculating survival time despite these factors, which collectively are called “censored” participants. Two outcomes are possible: either the study participant has the event outcome (i.e. they die), or they do not (i.e. they are censored).
Performing Kaplan Meier Analysis
For each time interval, the survival probability is calculated by:
Survival probability = number of participants surviving / number of participants at risk
Participants are not counted in the denominator (participants at risk) if they have dropped out, died, or not reached that time yet. The probability of survival to any point is the cumulative probability of surviving the preceding time intervals.
Actually calculating the Kaplan Meier analysis is usually performed with statistical software. Click the link for instructions in:
References
Kleinbaum, D. Survival Analysis: A Self-Learning Text, Third Edition (Statistics for Biology and Health) 3rd ed. 2012 Edition.
Survival Models. Retrieved November 1, 2011 from: http://data.princeton.edu/wws509/notes/c7.pdf
BIO 244: Survival Distributions, Hazard Functions, Cumulative Hazards. Retrieved November 1, 2011 from: https://web.stanford.edu/~lutian/coursepdf/unit1.pdf
Pitt University Survival Analysis. Retrieved November 1, 2011 from: http://www.pitt.edu/~super4/33011-34001/33051-33061.ppt