< Hypothesis tests < Rao’s spacing test
What is Rao’s spacing test?
Rao’s Spacing Test is a goodness of fit test for uniformity in circular data. It is often used to evaluate the support that data offers for the null hypothesis of uniformity. The idea is that if the data is uniform, then successive observations should be spaced approximately evenly around the circle, at about 360 degrees divided by the number of observations. Large deviations from this formula, or large spaces between observations, may indicate directionality.
The test statistic is
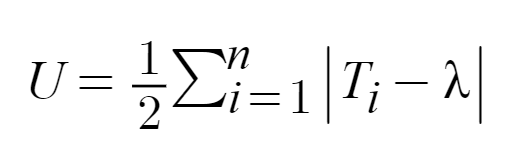
Where
- n = the number of observations,
- λ = 360/n,
- Ti = the angle of the ith observation in radians = fi + 1 and Tn = (360 – fn) + f1.
The test statistic is compared to a chi-squared critical value with n – 2 degrees of freedom; if the test statistic is greater than the critical value then you can reject the null hypothesis of uniformity.
In R, rao.spacing can be found in the CircStats library along with several other tests for circular data.
When to use Rao’s spacing test
While Rayleigh’s test of uniformity is usually recommended for unimodal data such as data that follows a von Mises distribution, Rao’s spacing test is more powerful for multimodal distributions [2] especially when the modes are distributed symmetrically around the circle. Rao’s spacing test may also be a better choice that the Rayleigh test when the distribution’s shape is expected to deviate from the bell-shaped von Mises distribution. That’s because Rao’s test makes no assumption about the shape of deviation from uniformity [3].
Rao’s spacing test is suitable for continuous, non-grouped data and is powerful with small sample sizes ≥ 5 [1]. As with other circular statistics, it is suitable for analyzing directional data, time series, similarity judgments involving musical pitch or color [4], phase relations in studies of movement [5] and spatial trends in geographical research [6].
In addition to Rayleigh’s test, other tests to consider for unimodal data include Watson’s U2 test and the Kuiper test. These tests are rotation-invariant, which means that the starting point of the data will not affect the test’s outcome.
References
- Bergin, T. 1991. A comparison of goodness-of-fit tests for analysis of nest orientation in Western Kingbirds (Tyrannus Verticalis). The Condor 93: 164-171.
- Kotz, S. and Read, C. B. [Eds.], (1997). Encyclopedia of Statistical Sciences, New York: John Wiley & Sons
- Landler L, Ruxton GD, Malkemper EP. Circular statistics meets practical limitations: a simulation-based Rao’s spacing test for non-continuous data. Mov Ecol. 2019 May 10;7:15. doi: 10.1186/s40462-019-0160-x. PMID: 31110771; PMCID: PMC6511169
- Levitin, D.J. (1994). Problems in applying the Kolmogorov-Smirnov Test: The need for circular statistics in psychology (Tech. Report #94-07). University of Oregon, Institute of Cognitive & Decision Sciences, Eugene, Oregon.
- Diedrich, F.J. and W.H. Warren, Jr. (1995). Why change gaits? Dynamics of the walk-run transition. Journal of Experimental Psychology: Human Perception & Performance, 21, 183-202.
- Lawson, A. (1988). On tests for spatial trend in nonhomogenous Poisson process. Journal of Applied Statistics, 15, 225-234.