Contents:
Circular Statistics
Circular statistics (or directional statistics) occurs around a circle. It involves data with no true zero and has no beginning or end on the number line; Designation of high or low values is arbitrary. For example [1]:
- Hours in a day,
- Months of the year,
- Compass directions.
Circular data can be vectorial (directed line segments with angle and direction) or axial (orientation is expressed with angle only).
As a practical example, in biology you might measure which way an animal is moving (in degrees or radians) or a periodic event like circadian rhythm [2]. In medicine, arrival times of patients in an emergency room can be analyzed to optimiza staffing levels [3]. Circular data also occurs in geology, meteorology, oceanography and physics.
The Von Mises distribution (VMD), a continuous probability distribution with a range from 0 to 2π, is one way to model circular data. The VMD is similar to the normal distribution, except coordinates are placed on a circular plane.
Summary Statistics in Circular Statistics
Different methods are needed to find circular statistics for circular data. The main problem to tackle in circular statistics is that quantities like angles, time, and date circles around and end up where they started from. Traditional methods for finding summary statistics do not work.
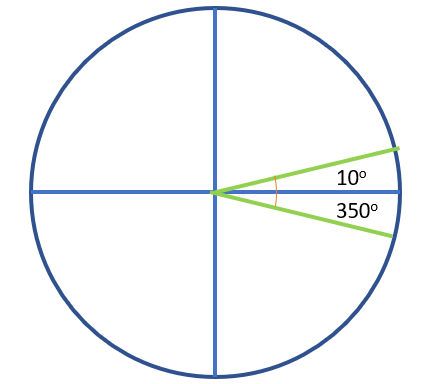
For example, consider two angles, 10° and 350°. If you use the traditional method to find the mean, you’ll get an arithmetic mean of (10° + 350°) / 2 = 180°. However, this is in the opposite direction for the two angles. The mean (the angle in the middle), is actually zero degrees. Therefore, the arithmetic mean is not applicable for circular data.
A visual representation of the data, like a circular histogram or circular scatter plot, should always be drawn to create summary statistics like the mean [3].
Circular Scatter Plot
A circular scatter plot (also called a polar scatter chart) shows the distribution of data on a circular plot—usually a unit circle [4]. It shows gradient directions, in terms of angles, and strengths or amounts of a variable of interest.
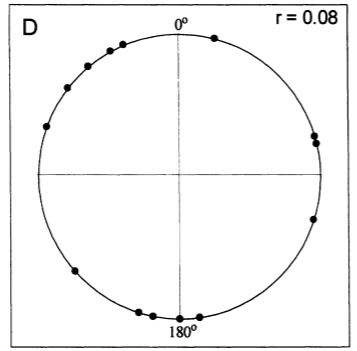
Zero correlation (which indicates that two sets of variables are not correlated at all) can also be shown by a circular scatter plot, although the plot will be circular only if the variance on variables X, Y are equal—something that rarely happens [6].
References
[1] Directional (Circular) Statistics. Retrieved July 29, 2021 from: http://webspace.ship.edu/pgmarr/Geo441/Lectures/Lec%2016%20-%20Directional%20Statistics.pdf
[2] Natar, J. & Thomas, K. Answering biological questions using circular data and analysis in R. Retrieved July 29, 2021 from: https://bigdata.duke.edu/sites/bigdata.duke.edu/files/site-images/FullLesson.html
[3] Scott, A. Circular Data: An Overview with discussion of one-sample tests. Retrieved July 29, 2021 from: https://math.montana.edu/grad_students/writing-projects/2002/02scott.pdf
[4] Cheeney R F (1983) Statistical Methods in Geology. London: George Allen & Unwin.
[5] Movements During Colony Foundling by Queens of the Honey Ant (Myrmecocystus mimicus Wheeler). Am. Midi. Nat. 144:439-444.
[6] Colman, A. (Ed.). (2019). Companion Encyclopedia of Psychology, Volume 2. Taylor and Francis.