Standardized Test Statistic Formula
If you’re taking the AP Statistics test, you’ll need to know the general formula for a standardized test statistic. Standardized test statistics are used in hypothesis testing. The general formula is:
Standardized test statistic: (statistic-parameter)/(standard deviation of the statistic).
The formula by itself doesn’t mean much, unless you also know the three major forms of the equation for z-scores and t-scores.
How to use these formulas: All of the formulas require you to insert three pieces of information:
- Your test statistic. For example, the median.
- The known population parameter.
- The standard deviation for the statistic.
Standardized test statistic for z-scores
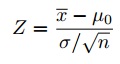
For easy steps on how to solve this formula, see: How to calculate a z-score.
T-score (single population)

For easy steps on how to solve this formula, see: What is a T Score Formula?
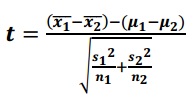
T-score (two populations)
What does a Standardized Test Statistic mean?
Standardized test statistics are a way for you to compare your results to a “normal” population. Z-scores and t-scores are very similar, although the t-distribution is a little shorter and fatter than the normal distribution. They both do the same thing. In elementary statistics, you’ll start by using a z-score. As you progress, you’ll use t-scores for small populations. In general, you must know the standard deviation of your population and the sample size must be greater than 30 in order for you to be able to use a z-score. Otherwise, use a t-score. See: T-score vs. z-score.
Calculating a Standardized Test Statistic: Example Problem
Need help with a homework question? Check out our tutoring page!
The mean life of a particular battery is 75 hours. A sample of 9 light bulbs is chosen and found to have a standard deviation of 10 hours and a mean of 80 hours. Find the standardized test statistic.
The population standard deviation isn’t known, so I’m going to use the t-score formula.
Step 1: Plug the information into the formula and solve:
x̄ = sample mean = 80
μ0 = population mean = 75
s = sample standard deviation = 10
n = sample size = 9
t = 80-75 / (10/√9) = 1.5.
This means that the standardized test statistic (in this case, the t-score) is 1.5.
Check out our YouTube channel for more stats help and tips!
References
Everitt, B. S.; Skrondal, A. (2010), The Cambridge Dictionary of Statistics, Cambridge University Press.
Gonick, L. (1993). The Cartoon Guide to Statistics. HarperPerennial.