Outliers > Modified Thompson Tau Test
What is the modified Thompson Tau Test?
The modified Thompson Tau test is a way to find outliers in a data set. The data set must be a single variable (e.g. x1, x2,…xn). One potential outlier is tested at a time using a version of the t-test. Roughly speaking, the Tau test eliminates outliers more than two standard deviations away from the mean.
Like most tests for outliers, there is the possibility that you could eliminate good data (especially if there is a cluster of outliers), so you should interpret the results of the test with caution.
Running the Test
In order to run the test, you first have to identify a possible outlier.
Example question: Are any of the following points outliers? : 489, 490, 490, 491, 494, 499, 499, 500, 501, and 505.
Step 1: Find the sample mean. The mean for this set of data is 495.8.
Step 2: Subtract the mean from the highest and lowest data point to find the absolute value of the differences. As a formula, that’s:
δi = |xi – x̄|.
So:
- |489 – 495.8.| = 6.8
- |505 – 495.8.| = 9.2
The point with the highest absolute difference (δ) is a suspected outlier. This is the one you’ll test. For this example, that’s 9.2.
Step 1: Look up the sample size (n) in the Tau table below to get the Tau value (for the formula behind the table calculations see Tau Formula below):
For a sample size of 10, Tau is 1.7984.
Step 2: Calculate the standard deviation (s) for the sample. For this set of data, s = 5.67.
Step 3: Multiply Tau (Step 1) by s (Step 2):
Tau * s = 1.7984 * 5.67 = 10.2
Step 4: Compare the absolute difference (δ) for the suspected outlier (from Part 1) with Tau * s (Step 3).
If δ > Tau * s, the point is an outlier.
9.2 is not greater than 10.2, so is therefore not an outlier.
Repeating the Steps
In the above example, the point with the largest absolute difference was not an outlier. If the point is an outlier, repeat the steps above for the point with the next largest deviation. However, when you repeat the calculations, you must remove the outlier you identified before recalculating the mean and finding the new Tau.
Tau Table
| n | Tau | n | Tau | n | Tau |
|---|---|---|---|---|---|
| 3 | 1.1511 | 21 | 1.8891 | 40 | 1.9240 |
| 4 | 1.4250 | 22 | 1.8926 | 42 | 1.9257 |
| 5 | 1.5712 | 23 | 1.8957 | 44 | 1.9273 |
| 6 | 1.6563 | 24 | 1.8985 | 46 | 1.9288 |
| 7 | 1.7110 | 25 | 1.9011 | 48 | 1.9301 |
| 8 | 1.7491 | 26 | 1.9035 | 50 | 1.9314 |
| 9 | 1.7770 | 27 | 1.9057 | 55 | 1.9340 |
| 10 | 1.7984 | 28 | 1.9078 | 60 | 1.9362 |
| 11 | 1.8153 | 29 | 1.9096 | 65 | 1.9381 |
| 12 | 1.8290 | 30 | 1.9114 | 70 | 1.9397 |
| 13 | 1.8403 | 31 | 1.9130 | 80 | 1.9423 |
| 14 | 1.8498 | 32 | 1.9146 | 90 | 1.9443 |
| 15 | 1.8579 | 33 | 1.9160 | 100 | 1.9459 |
| 16 | 1.8649 | 34 | 1.9174 | 200 | 1.9530 |
| 17 | 1.8710 | 35 | 1.9186 | 500 | 1.9572 |
| 18 | 1.8764 | 36 | 1.9198 | 1000 | 1.9586 |
| 19 | 1.8811 | 37 | 1.9209 | 5000 | 1.9597 |
| 20 | 1.8853 | 38 | 1.9220 | → ∞ | 1.9600 |
Tau Formula
If you’re using the table, you don’t really need the formula (unless you’re calculating some specific sample size not listed). Tau is calculated from T critical values of student’s T-distribution, which identify a rejection region. The formula is:
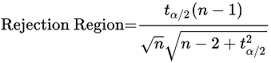
Where:
- n = sample size
- tα/2 = student’s T critical value (based on an alpha level of 5%) with two degrees of freedom