The Gamma Poisson distribution (GaP) is a mixture model with two positive parameters, α and β.
This hierarchical distribution is used to model a variety of data including failure rates, RNA-Sequencing data [1] and random distribution of micro-organisms in a food matrix [2]. When a Gamma distribution doesn’t fit data because the overall distribution from multiple samples is too spread out (i.e., the variance is greater than the mean), the Gamma Poisson may be a good fit.
Gamma Poisson Distribution PDF
The probability mass function is [3]:
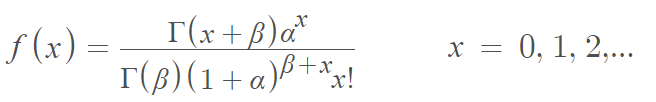
Where Γ denotes the gamma function.
Connection to the Negative Binomial Distribution
The negative binomial distribution can arise from a gamma mixture of Poisson distributions. Specifically, this can happen when the density distribution across sample plots follows a gamma distribution with scale dependent parameters and a constant mean [4]. It is perhaps for this reason that the GaP process is sometimes called the negative binomial process [5] although it is more technically a form of the negative binomial rather than its equivalent [6].
References
[1] Holmes, S. & Huber, W. 4 Mixture Models.
[2] Toft, N. et al. The Gamma–Poisson model as a statistical method to determine if micro-organisms are randomly distributed in a food matrix. Food Microbiology. Volume 23, Issue 1, February 2006, Pages 90-94.
[3] Gamma-Poisson Distribution. Retrieved December 8, 2021 from: http://www.math.wm.edu/~leemis/chart/UDR/PDFs/Gammapoisson.pdf
[4] Magnussen, S. (2008). A Gamma-Poisson Distribution of Point to k Nearest Event Distance. Forest Science 54(4): 429-441.
[5] Ewing, S. & Kunz, M. Fitting of Failure Rate Data to Gamma-Poisson Distribution Utilizing Method of Moments. Retrieved January 8, 2021 from: https://inldigitallibrary.inl.gov/sites/sti/sti/8059210.pdf
[6] Engelhardt, M. (1994). Events in Time: Basic Analysis of Poisson Data.