Probability Distribution: List of Statistical Distributions >
The Skellam distribution (also called the Poisson difference distribution) is a discrete probability distribution that shows differences between counts. It is derived from differences between Poisson random variables (i.e., two random variables that originate from a Poisson distribution) [1]. Although the distribution is usually used for independent random variables, it can be applied to a special case of dependent variables when the two variables have a common additive random contribution — one that is canceled by differencing [2].
The distribution, first formulated by Skellam in 1946 [3], is used in a wide number of applications including:
- Image detection and denoising [4],
- Showing the spread of points in sports, where points are equal (e.g., hockey, soccer) [5],
- Studying treatment effects [6],
- Modeling noise in PET imaging [7].
Skellam Distribution PMF
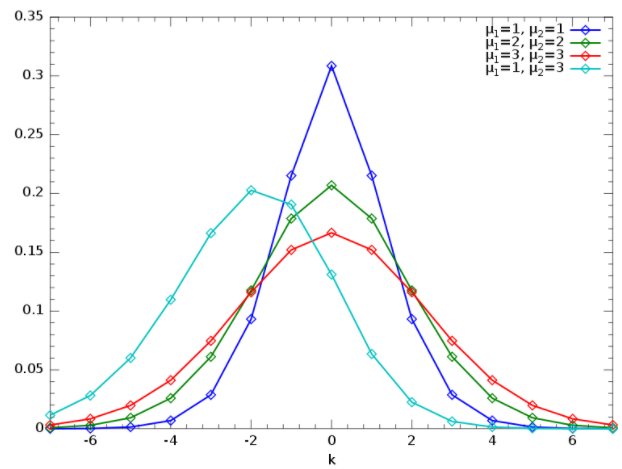
The Skellam distribution, which returns values between (-∞, ∞), is a function of the difference k between two Poisson random variables. It is expressed by the probability mass function (PMF) as [8]:
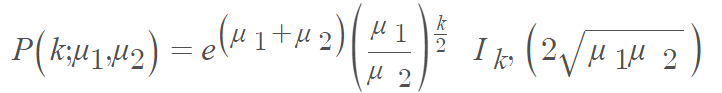
Where:
- μ1 and μ2 are expected values or means of two Poisson distributions,
- Ik (z) is the modified Bessel function of the first kind.
References
PMF Examples image Krishnavedala, CC0, via Wikimedia Commons.
[1] Sellers, K. A distribution describing common differences in count data containing common disperson levels. Advanced and Applications in Statistical Science. Volume 7, Issue 3, March-April 2012, Pages 35-46. Mill Publications.
[2] Karlis, D. and Ntzoufras, I. (2003) “Analysis of sports data using bivariate Poisson models“. Journal of the Royal Statistical Society, Series D, 52 (3), 381–393. doi:10.1111/1467-9884.00366
[3] Skellam, J. G. (1946) “The frequency distribution of the difference between two Poisson variates belonging to different populations”. Journal of the Royal Statistical Society, Series A, 109 (3), 296.
[4] Hirakawa, K. et al. Wavelet-based Poisson Rate Estimation using the Skellam distribution, in C.A. Bouman et al. (Eds.). Proceedings of SPIE 7246 (2009).
[5] Karlis, D. & Ntoufras, I. Bayesian modelling of football outcomes: using the Skellam’s distribution for the goal difference. IMA J. Manag. Math 20(2) (2008), 133-145.
[6] Karlis, D. & Ntzoufras, I. Bayesian analysis of the differences of count data, Stat. Med. 25 (2006), 185-1905.
[7] M. Yavuz and J. A. Fessler. Maximum likelihood emission image reconstruction for randoms-precorrected pet scans. In IEEE Nuclear Science Symposium Conference Record, pages 15/229–15/233, 2000
[8] Hwang, Y. et al. Statistical background subtraction based on the exact per-pixel distributions. MVA2007 IAPR Conference on Machine Vision Applications, May 16-18, 2007, Tokyo, JAPAN from: https://citeseerx.ist.psu.edu/viewdoc/download?doi=10.1.1.145.2875&rep=rep1&type=pdf