Statistics Definitions > Conditional Distribution
You may want to read this article first, as it introduces marginal and conditional distributions: What is a Marginal Distribution?
What is a Conditional Distribution?
A conditional distribution is a probability distribution for a sub-population. In other words, it shows the probability that a randomly selected item in a sub-population has a characteristic you’re interested in. For example, if you are studying eye colors (the population) you might want to know how many people have blue eyes (the sub-population). Conditional distributions are easier to find with the help of a table.
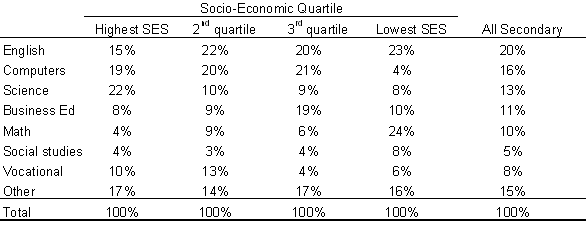
The following table shows how computer use differs across socio-economic backgrounds. The table shows the “big picture” across all subjects for the entire sample. SES in the table stands for socio-economic status.
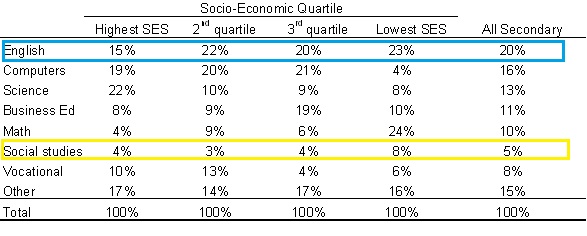
This is a regular frequency distribution table. But you can place conditions on it. For example, you could say we’re only interested in how computers are used for English classes or the Social Sciences. The highlighted areas in the chart below are the conditional distributions for Math (blue) and Social Sciences (yellow).
Conditional Distributions vs. Marginal Distributions.
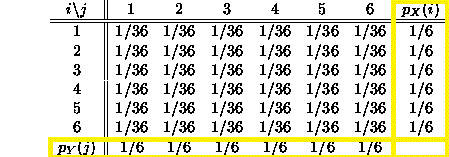
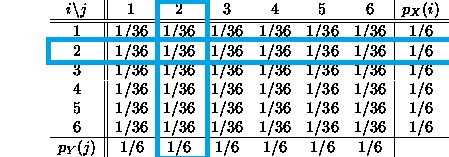
Marginal and conditional distributions can be found the same table. Marginal distributions are the totals for the probabilities. They are found in the margins (that’s why they are called “marginal”). The following table shows probabilities for rolling two dice. The total probabilities in the margins are the marginal distributions.
A conditional distribution on this table would be a sub-population. In this case, the sub populations would be the different dice rolls. For example, you might want to know the probability of rolling a two.
How to Calculate Conditional Distribution Probability
Watch the video for an example:

Can’t see the video? Click here to watch it on YouTube.
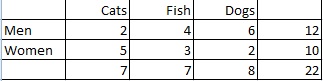
Sample question: Calculate the conditional distribution of pet preference among women.
Solution:
Step 1: Count the total number of women. In this case the total is in the right hand column (10 women).
Step 2: Count the number of women who prefer each pet type. Turn the ratio into a probability:
- Women who prefer cats: 5/10 = .5
- Women who prefer fish: 3/10 = .3
- Women who prefer dogs: 2/10 = .2
Tip: You can check your answer by making sure the probabilities all add up to 1.
Check out our YouTube channel for more stats help and tips!
References
Beyer, W. H. CRC Standard Mathematical Tables, 31st ed. Boca Raton, FL: CRC Press, pp. 536 and 571, 2002.
Gonick, L. (1993). The Cartoon Guide to Statistics. HarperPerennial.
Vogt, W.P. (2005). Dictionary of Statistics & Methodology: A Nontechnical Guide for the Social Sciences. SAGE.
Wheelan, C. (2014). Naked Statistics. W. W. Norton & Company