- What is a Sample Size?
- How to Find a Sample size:
- Part One: General Tips.
- Cochran’s Sample Size Formula
- Yamane’s Sample Size Formula
- Known Confidence Interval and Width (unknown population standard deviation).
- Known Confidence Interval and Width (known population standard deviation).
- Find a sample size to estimate a population mean
- Use Excel to find a sample size.
Watch the video for an overview of how to find a sample size:
What is a “Sample Size”?
A sample size is a part of the population chosen for a survey or experiment. For example, you might take a survey of dog owner’s brand preferences. You won’t want to survey all the millions of dog owners in the country (either because it’s too expensive or time consuming), so you take a sample size. That may be several thousand owners. The sample size is a representation of all dog owner’s brand preferences. If you choose your sample wisely, it will be a good representation.
When Error can Creep in
When you only survey a small sample of the population, uncertainty creeps in to your statistics. If you can only survey a certain percentage of the true population, you can never be 100% sure that your statistics are a complete and accurate representation of the population. This uncertainty is called sampling error and is usually measured by a confidence interval. For example, you might state that your results are at a 90% confidence level. That means if you were to repeat your survey over and over, 90% of the time your would get the same results.

Back to top
How to Find a Sample Size in Statistics
A sample is a percentage of the total population in statistics. You can use the data from a sample to make inferences about a population as a whole. For example, the standard deviation of a sample can be used to approximate the standard deviation of a population. Finding a sample size can be one of the most challenging tasks in statistics and depends upon many factors including the size of your original population.
General Tips
Step 1: Conduct a census if you have a small population. A “small” population will depend on your budget and time constraints. For example, it may take a day to take a census of a student body at a small private university of 1,000 students but you may not have the time to survey 10,000 students at a large state university.
Step 2: Use a sample size from a similar study. Chances are, your type of study has already been undertaken by someone else. You’ll need access to academic databases to search for a study (usually your school or college will have access). A pitfall: you’ll be relying on someone else correctly calculating the sample size. Any errors they have made in their calculations will transfer over to your study.
Step 3: Use a table to find your sample size. If you have a fairly generic study, then there is probably a table for it. For example, if you have a clinical study, you may be able to use a table published in Machin et. al’s Sample Size Tables for Clinical Studies, Third Edition.
Step 4: Use a sample size calculator. Various calculators are available online, some simple, some more complex and specialized. For example, this calculator is for group- or cluster-randomized trials (GRTs).
Step 5: Use a formula. There are many different formulas you can use, depending on what you know (or don’t know) about your population. If you know some parameters about your population (like a known standard deviation), you can use the techniques below. If you don’t know much about your population, use Slovin’s formula..
Back to top
Cochran’s Sample Size Formula
Watch the video for an example:
The Cochran formula allows you to calculate an ideal sample size given a desired level of precision, desired confidence level, and the estimated proportion of the attribute present in the population.
Cochran’s formula is considered especially appropriate in situations with large populations. A sample of any given size provides more information about a smaller population than a larger one, so there’s a ‘correction’ through which the number given by Cochran’s formula can be reduced if the whole population is relatively small.
The Cochran formula is:
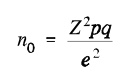
Where:
- e is the desired level of precision (i.e. the margin of error),
- p is the (estimated) proportion of the population which has the attribute in question,
- q is 1 – p.
The z-value is found in a Z table.
Cochran’s Formula Example
Suppose we are doing a study on the inhabitants of a large town, and want to find out how many households serve breakfast in the mornings. We don’t have much information on the subject to begin with, so we’re going to assume that half of the families serve breakfast: this gives us maximum variability. So p = 0.5. Now let’s say we want 95% confidence, and at least 5 percent—plus or minus—precision. A 95 % confidence level gives us Z values of 1.96, per the normal tables, so we get
((1.96)2 (0.5) (0.5)) / (0.05)2 = 385.
So a random sample of 385 households in our target population should be enough to give us the confidence levels we need.
Modification for the Cochran Formula for Sample Size Calculation In Smaller Populations
If the population we’re studying is small, we can modify the sample size we calculated in the above formula by using this equation:
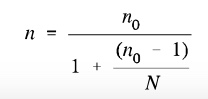
Here n0 is Cochran’s sample size recommendation, N is the population size, and n is the new, adjusted sample size. In our earlier example, if there were just 1000 households in the target population, we would calculate
385 / (1 + ( 384 / 1000 )) = 278
So for this smaller population, all we need are 278 households in our sample; a substantially smaller sample size.
Yamane’s Formula
Yamane’s formula is:
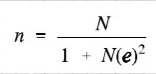
Where:
- e = precision level
- N = population size.
Watch the video for an example:
How to Find a Sample Size Given a Confidence Level and Width (unknown population standard deviation)
Part two shows you how to find a sample size for a given confidence level and width (e.g. 95% CL, 6% wide) for an unknown population standard deviation.
Example question: 41% of Jacksonville residents said that they had been in a hurricane. How many adults should be surveyed to estimate the true proportion of adults who have been in a hurricane, with a 95% confidence interval 6% wide?
Step 1: Using the data given in the question, figure out the following variables:
- za/2: Divide the confidence level by two, and look that area up in the z-table:
.95 / 2 = 0.475
The closest z-score for 0.475 is 1.96. - E (margin of error): Divide the given width by 2.
6% / 2
= 0.06 / 2
= 0.03  : use the given percentage. 41% = 0.41. If you aren’t given phat, use 50%.
  : subtract from 1.
1 – 0.41 = 0.59
Step 2:Multiply ![]() by
by ![]() . Set this number aside for a moment.
. Set this number aside for a moment.
0.41 × 0.59 = 0.2419
Step 3: Divide Za/2 by E.
1.96 / .03 = 65.3333333
Step 4: Square Step 3:
65.3333333 × 65.3333333 = 4268.44444
Step 5: Multiply Step 2 by Step 4:
0.2419 × 4268.44444 = 1,032.53671
= 1,033 people to survey.
Back to top
How to Find a Sample Size Given a Confidence Level and Width (known population standard deviation)
Part 3 shows you how to determine the appropriate sample size for a given confidence level and width, given that you know the population standard deviation.
Example question: Suppose we want to know the average age of an Florida State College student, plus or minus 0.5 years. We’d like to be 99% confident about our result. From a previous study, we know that the standard deviation for the population is 2.9.
Step 1: Find z a/2 by dividing the confidence level by two, and looking that area up in the z-table:
.99/2 = 0.495. The closest z-score for 0.495 is 2.58.
Step 2: Multiply step 1 by the standard deviation.
2.58 * 2.9 = 7.482
Step 3: Divide Step 2 by the margin of error. Our margin of error (from the question), is 0.5.
7.482/0.5 = 14.96
Step 4: Square Step 3.
14.96 * 14.96 = 223.8016
Find a sample size to estimate a population mean
Watch the video to find out how to find a sample size if you want to estimate means:
How to find a sample size in Excel.
Watch the video or read the steps below:
How to use Excel Sampling to find a Sample
If you have a set of data and you know your sample size, you can use Excel’s Data Analysis toolpak to select either a periodic sample or a random sample. A random sample is just that — randomly selected from your data set. A periodic sample (also called a systematic sample) is where Excel chooses the nth data item to include in your sample. For example, if you wanted to choose every 5th number from the following list: 4, 5, 6, 7, 8, 9, 10, 11, 12, 13, 14, Excel would return 8 and 13 (the 5th and 10th numbers in order).
If you don’t know what sample size you need, calculate it before using the Data Analysis tool (using the methods outlined at the top of this article). The Data Analysis tool can help you extract a sample, but it can’t help you decide on the size. Why? There are many “human” factors that go into selecting a sample size including budget, prior research (you can use a sample size from previous research) and tables constructed from previous research.
How to use Excel Sampling to find a Sample: Steps
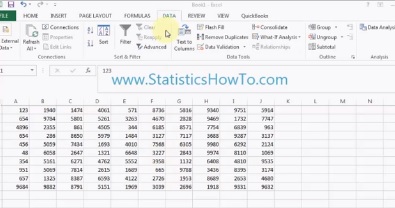
Step 1: Enter your data items into Excel. You can enter your data into rows or columns. Ensure the rows and columns are even; for example, enter data into column A to cell 12 and column B to cell 12.
Step 2: Click “Data” and then click “Data Analysis.” If you don’t see Data Analysis on your toolbar, load the Data Analysis Toolpak.
Step 3: Click “Sampling” and then click “OK.”
Step 4: Click in the Input Range box and then select your entire data set.
Step 5: Click either “Periodic Sampling” or “Random Sampling.” If you choose periodic, enter the nth number (i.e. every 5) and if you choose random sampling, enter the sample size.
Step 6: Choose an output range. For example, click the “New Worksheet” button and Excel will return the sample in a new worksheet.
Step 7: Click “OK.”
That’s it!
Check out our YouTube channel for more Excel tips and help!
Back to top
Related Articles
Ways to Reduce Sample Size.
Effective Sample Size..
Unequal sample size.
References
Bartlett, J. et al. (2001). Organizational Research: Determining Appropriate Sample Size in Survey Research. Retrieved January 15, 2018 from: http://citeseerx.ist.psu.edu/viewdoc/download?doi=10.1.1.486.8295&rep=rep1&type=pdf.
Evans, M.; Hastings, N.; and Peacock, B. Statistical Distributions, 3rd ed. New York: Wiley, 2000.
Israel, G. (n.d.) Determining Sample Size. University of Florida IFAS Extension. Article posted on Tarleton State University website. Retrieved January 13, 2018 from https://www.tarleton.edu/academicassessment/documents/Samplesize.pdf.