Contents:
- What is a Mean Difference?
- Standardized Mean Difference
- Hypothesized Mean Difference
- Sampling Distribution of the Difference Between Means
- Testing for Differences Between Means
What is a Mean Difference (MD)?
The mean difference, or difference in means, measures the absolute difference between the mean value in two different groups. In clinical trials, it gives you an idea of how much difference there is between the averages of the experimental group and control groups.
Note: Although a lot of authors use the term mean difference, it makes more intuitive sense to say difference between means. That’s because you aren’t actually calculating any means; You’ll already have two or more means, and all you need to do is find a difference between them. In other words, you’re finding a difference between means and not a mean of differences.
Why “Absolute Differences?”
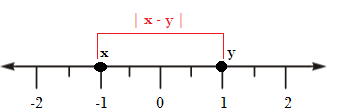
The definition calls for finding the absolute difference between two items.
In math, a difference is a subtraction. For example, the difference between 10 and 2 is 8 (10 – 2 = 8). However, you run into problems with negative numbers. For example, the difference between -1 and 1 is: -1 – 1 = -2. In real life terms, a difference, or distance, makes more sense if it’s a positive value, so we take the absolute value of the difference: |-2| = 2.
Standardized Mean Difference
Sometimes you’ll want to compare means between groups but you can’t because they have different unit measurements. For example, studies measuring depression might use different depression rating scales. The standardized mean difference (SMD) is a way to measure effect size; it standardizes test results so that they can be compared. For example, a SMD of 0.60 based on outcomes A from one study is equal in comparison to a SMD of 0.60 calculated on the same outcome A in a separate study (SMDs are typically rounded off to two decimal places).
The general formula is:
SMD = Difference in mean outcome between groups / Standard deviation of outcome among participants
However, the formula differs slightly according to which SMD statistic you use. For example, the Cohen’s D version uses a pooled standard deviation while the Hedges’ g version uses a weighted and pooled standard deviation.
Hypothesized Mean Difference
The hypothesized mean difference comes up in programs like Excel, when you run certain tests (like a t-test). You’re basically telling the program what’s in your hypothesis statements, so you must know your null hypothesis. For example, let’s say you had the following hypothesis statements:
- Null Hypothesis: M1 – M2 = 10
- Alternative Hypothesis: M1 – M2 ≠ 10
You’ll put 10 in the hypothesized mean difference box, because that’s what your null hypothesis states. If you hypothesize there’s no difference, enter 0.
Excel doesn’t allow negative values here, so if you suspect there’s a negative difference, switch your variables around (so you’ll actually be testing for a positive difference).
Sampling distribution of the difference between means
The sampling distribution of the difference between means is all possible differences a set of two means can have. The formula for the mean of the sampling distribution of the difference between means is:
For example, let’s say the mean score on a depression test for a group of 100 middle-aged men is 35 and for 100 middle-aged women it is 25. If you took a large number of samples from both these groups and calculated the mean differences, the mean of all of the differences between all sample means would be 35 – 25 = 10.
Testing for Differences Between Means
On its own, the mean difference doesn’t tell you a lot (other than give you a number for the difference). The number may be statistically significant, or it could just be due to random variations or chance. In order to test the hypothesis that your results could be significant, run a hypothesis test for differences between means.
To compare two independent means, run a two-sample t test . This test assumes that the variances for both samples are equal. If they are not, run Welch’s test for unequal variances instead.
For dependent samples (i.e. samples that are connected in some way) run a paired samples t-test.
References
Agresti A. (1990) Categorical Data Analysis. John Wiley and Sons, New York.
Gonick, L. (1993). The Cartoon Guide to Statistics. HarperPerennial.
Klein, G. (2013). The Cartoon Introduction to Statistics. Hill & Wamg.
Levine, D. (2014). Even You Can Learn Statistics and Analytics: An Easy to Understand Guide to Statistics and Analytics 3rd Edition. Pearson FT Press