Statistics Definitions > Rician Distribution
What is a Rice/Rician Distribution?
A Rice or Rician distribution (also known as a Nakagami-n distribution) is one way to model the paths scattered signals take to a receiver.
Specifically, this distribution models line-of-sight scatter — transmissions between two stations in view of each other that have an unobstructed path between them. Line-of-sight scatter includes FM radio waves, microwaves, MRI images in the presence of noise, and satellite transmissions.
Frequently found in the analysis of time variant systems — where multiple moving signals must be analyzed, they give more control over the extent of fading than the Rayleigh distribution. The distribution also models Rician fading, which is a way to show how signal cancellations affect radio propagation.
Properties of the Rice Distribution
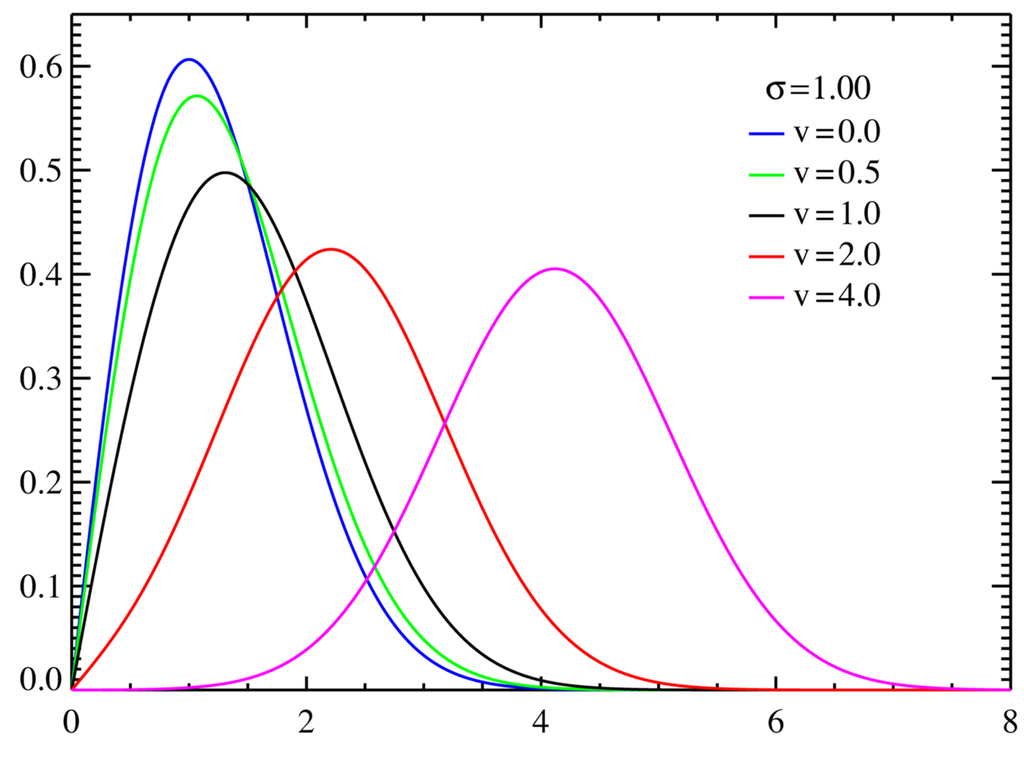
Two shape parameters define the Rician distribution: ν and σ. These, along with a third number, m, define the qualities of the probability density function. “m” controls the horizontal location of the distribution’s maximum value. The distribution is unimodal with thin tails (the tails decrease exponentially for large x-values). The probability density function (pdf) is:
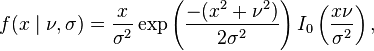
- ν and σ are parameters,
- I0(z) is a modified Bessel function of the first kind with order zero.
The support of the Rician distribution is real positive numbers; the interval is {a, ∞) where a is any real positive number (i.e., positive numbers that can be found on the number line).
The distribution is valid for real positive numbers. In other words, the interval for this distribution is {a, ∞) where a is any real positive number (real numbers are numbers that can be found on the number line).
Uses of the Rice distribution
A Rician distribution models the paths that scattered signals take to a receiver. This distribution models line-of-sight scatter, such as microwaves or FM radio waves, that occurs when two stations in view of each other have an unobstructed path between them.
The Rician distribution can also model Rician fading which show how signal cancellations can affect radio propagation. Rician fading occurs when a radio signal is transmitted through a multipath environment. When the signal travels through multiple paths of varying lengths and attenuations, it is received as the sum of multiple signals, each with its own amplitude and phase. The amplitude of the received signal follows a Rician distribution, which is more peaked than the Rayleigh distribution seen in single-path environments. As a result of this peaked distribution, the probability of receiving a large amplitude signal is higher while the probability of receiving a small amplitude signal is lower.
Rician distributions can only model non-dense, line-of-sight signals. Distributions that model dense scattered signals include the Nakagami distribution as well as the Rayleigh distribution.

Similar Distributions
This distribution is closely related to a number of other distributions, including the Beckmann distribution, Chi-Square distribution, Chi Distribution, Normal and Log Normal Distributions, Rayleigh distribution and Nakagami Distribution.
- The Rice Distribution is related to the normal distribution, because it is basically the distribution of the norm of two normally distributed variables.
- The pdf of the Rice distribution [ν, σ] is the same as the Beckmann Distribution with parameters [ν/√2, ν/√2, σ, σ].
- The pdf of the Rice distribution [0, σ] is the same as the pdf of the Rayleigh distribution [σ]
Rician distributions can only model non-dense, line-of-sight signals. Distributions that model dense scattered signals:
References
- Image: PAR-commonswiki|Wikimedia Commons. GNU 1.3.