Descriptive Statistics > Upper and Lower Fence
What are upper and lower fences?
Upper and lower fences cordon off outliers from the bulk of data in a set. Fences are usually found with the following formulas:
- Upper fence = Q3 + (1.5 * IQR)
- Lower fence = Q1 – (1.5 * IQR).
Where IQR is the interquartile range. Sometimes the value 1.5 is replaced by another value (usually 3), but you’ll usually see 1.5 unless you’re calculating inner and outer fences.
Inner and Outer Fences
Fences can be used to illustrate extreme values (outliers) in box plots. Sometimes you might see reference to “inner fences” and “outer fences”. These are defined as:
- Lower inner fence: Q1 – (1.5 * IQR)
- Upper inner fence: Q3 + (1.5 * IQR)
- Lower outer fence: Q1 – (3 * IQR)
- upper outer fence: Q3 + (3 * IQR)
Points beyond the inner fences in either direction are mild outliers; points beyond the outer fences in either direction are extreme outliers.
Need help with a homework question? Check out our tutoring page!
Example:
Which of the following data points are outliers?
29, 179, 180, 201, 300, 301, 304, 350, 399, 401, 455, 501, 503, 540, 543, 549, 560, 561, 562, 563, 569, 570, 599, 601, 603, 650, 701, 703, 704, 709, 713, 733, 745, 801, 900, 982, 983, 985, 999, 1001, 1002, 1003, 1009, 1100, 1101, 1102, 1103, 1109, 1201, 1301, 1399, 1400, 1501, 1599, 1699.
Step 1: Find the 25th percentile (Q1), the 75th percentile (Q3), and the interquartile range. Our interquartile range calculator can do this for you, or if you want to calculate these manually, see How to Find an Interquartile Range for step by step instructions (with video). From the calculator, we get:
- 25th Percentile: 540
- 75th Percentile: 1003
- Interquartile Range: 463
Step 2: Insert the values from Step 1 into the formulas and solve:
- Lower inner fence: Q1 – (1.5 * IQR) = 540 – (1.5 * 463) = -154.5
- Upper inner fence: Q3 + (1.5 * IQR) = 1003 + (1.5 * 463) = 1697.5
- Lower outer fence: Q1 – (3 * IQR) = 540 – (3 * 463) = -849
- upper outer fence: Q3 + (3 * IQR) = 1003 + (3 * 463) = 2392
Step 3: Plot the upper and lower fences on a box plot. Not necessarily statistically, but it makes outliers easier to spot:
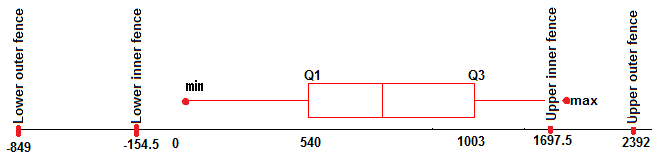
Only one point (1699) is an outlier, because it lies outside the fences. As it’s over the upper inner fence but not over the upper outer fence, it’s considered a mild outlier.
The definitions for the outer and inner fences only represent the maximum value where the whiskers could go, if the data set actually contained those values. In other words, the whiskers don’t extend to the fences unless there are actual data points at those places. Whiskers represent data points; Fences represent theoretical cut-off points.
References:
Everitt, B. S.; Skrondal, A. (2010), The Cambridge Dictionary of Statistics, Cambridge University Press.
Tukey, J. (1977). Exploratory Data Analysis, Addison-Wesley.