Descriptive Statistics > Grubbs’ Test
What is Grubbs’ Test for Outliers?
Grubbs’ test is used to find a single outlier in a normally distributed data set. The test finds if a minimum value or a maximum value is an outlier.
Cautions:
- The test is only used to find a single outlier in normally distributed data (excluding the potential outlier). If you think that your data set has more than one outlier, use the generalized extreme studentized deviate test or Tietjen-Moore test instead.
- Using this test on non-normal distributions will give false results.
Run a test for normality (like the Shapiro-Wilk test) before running Grubbs’ test. If you find your data set isn’t normally distributed, try removing the potential outlier from the data set and running the normality test again. If your data still isn’t normal, don’t run this test.
Running Grubbs’ Test
The test is a deceptively simple one to run. It checks for outliers by looking for the maximum of the absolute differences between the values and the mean. Basically, the steps are:
- Find the G test statistic.
- Find the G Critical Value.
- Compare the test statistic to the G critical value.
- Reject the point as an outlier if the test statistic is greater than the critical value.
The formulas used will be slightly different, depending on if you want to check for an outlier in either end of the data (a one tailed test) or in both ends at the same time (a two tailed test). For simplicity, I’d recommend running a one-tailed test to start, as it a/is an easier equation to work by hand and b/ it simplifies the decision to reject (or keep) a single minimum or maximum point.
1. Find the G Test Statistic
Step 1: Order the data points from smallest to largest.
Step 2: Find the mean (x̄) and standard deviation of the data set.
Step 3: Calculate the G test statistic using one of the following equations:
The Grubbs’ test statistic for a two-tailed test is:
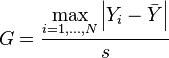
Where:
ȳ is the sample mean,
s = sample standard deviation.
A left-tailed test uses the test statistic:
![]()
Where Ymin is the minimum value.
For a right-tailed test, use:
![]()
Where Ymax is the maximum value.
2. Find the G Critical Value.
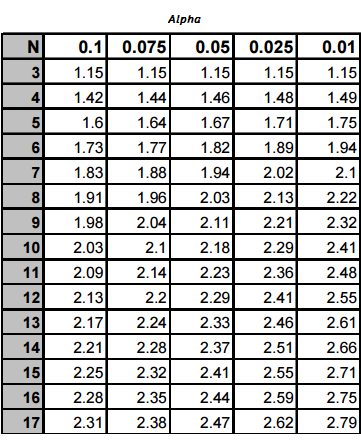
Several tables exist for finding the critical value for Grubbs’ test. The one below is a partial table for several G critical values and alpha levels. You can find the full table here. When looking up tables for G critical values, make sure you’re using the right one (i.e. a one-tailed test or two).
Manually, you can find the G critical value with a formula.
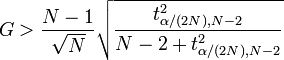
Where:
tα/(2N),N−2 is the upper critical value of a t-distribution with N-2 degrees of freedom.
For one-tailed test, replace α/(2N) with α/N.
Accept or Reject the Outlier
Compare your G test statistic to the G critical value:
Gtest < Gcritical: keep the point in the data set; it is not an outlier.
Gtest > Gcritical: reject the point as an outlier.