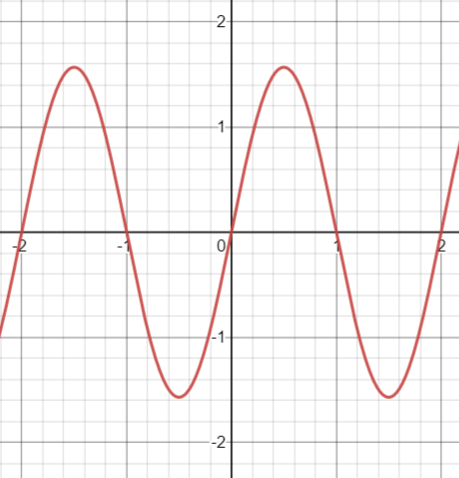
The sine distribution (also called Gilbert’s sine distribution) is a continuous probability distribution based on a part of the sine curve. It can fit a set of data that has several peaks, assuming that the data came from a genuine multimodal distribution and not a mixture distribution [1].

The distribution was introduced in 1892 by geologist G.K. Gilbert who used the distribution to study moon craters. A useful aspect of this particular distribution is that, unlike many other parent distributions, order statistics can be formulated with elementary functions. To manipulate this distribution, you should be familiar with circular (trigonometric) functions [2].
A random variable Z follows a sine distribution if its density function is
fz(z) = F′z = ½ cos(z), if |z| ≤ π/2 (otherwise, the density function = 0).
The standard sine distribution is formulated as [3]
g(z) = (π/2) sin(πz), z∈[0, 1].
All moments exist, but have a complicated general formula which involves special functions.
Sine Distribution Uses
Although the sine distribution is seldom used, it does occasionally appear in the literature. For example, one NASA publication noted that a chopped version of the distribution is a good fit for the influence that radiation exchange between elements on the inside surface of a tube have on temperature [4].
References
Standard distribution graphed with Desmos.
[1] Golchrist, W. (2000). Statistical Modelling with Quantile Functions. CRC Press.
[2] Burrows, P. (2012). Extreme Statistics from the SD. Retrieved December 30, 2021 from: https://www.tandfonline.com/doi/abs/10.1080/00031305.1986.10475396?journalCode=utas20
[3] Siegrist, K. 5.27: The Sine Distribution. Retrieved December 30, 2021 from: https://stats.libretexts.org/Bookshelves/Probability_Theory/Probability_Mathematical_Statistics_and_Stochastic_Processes_(Siegrist)/05%3A_Special_Distributions/5.27%3A_The_Sine_Distribution
[4] NASA Technical Note (1962).