Probability Distributions > Nakagami Distribution
What is the Nakagami Distribution?
The Nakagami distribution (also called the Nakagami-m or Nakagami-μ distribution) is a fairly new probability distribution, first appearing in 1960. It is a generalized way to model small scale fading for dense signal scatters and it one of the most common distributions for modeling right-skewed, positive data sets. Real world applications include modeling wireless signal and radio wave propagation, characterizing breast tumors using ultrasound imaging and in meteorology.
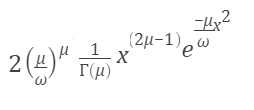
The probability density function formula is:

Where:
- μ is the shape parameter.
- ω is the scale parameter (ω > 0 for all x > 0). This parameter controls the spread of the distribution.
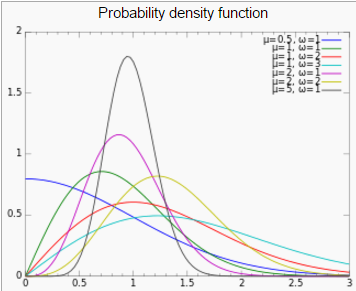
The two parameters combined determine the height, steepness and concavity of the probability density curve. The distribution is only valid on the interval (0,∞). In other words, if x ≤ 0, then the probability is zero.

The tails are usually thin, meaning that the tail decreases exponentially for large x-values.
Relation to Other Distributions
The distribution is related to the gamma distribution: if x has shape parameter μ and scale parameter ω, then x2 has a gamma distribution with shape parameter μ and scale parameter ω/μ.
Nakagami-q Distribution / Hoyt Distribution
If the shape parameter is restricted to the interval q=μ; 0 > q > 1, the distribution is called Nakagami-q, also known as the Hoyt distribution or Nakagami-Hoyt distribution. Like the Nakagami-w, the scale parameter must be positive and the tails are relatively thin. Close to the mean, the Nakagami distribution is a good approximation to the Rician distribution. However, towards the tails they differ significantly.
Reference:
Nakagami, M. (1960) “The m-Distribution, a general formula of intensity of rapid fading”. In William C. Hoffman, editor, Statistical Methods in Radio Wave Propagation: Proceedings of a Symposium held June 18–20, 1958, pp 3-36. Pergamon Press.