Parallel boxplots (or parallel box-and-whisker plots) are a comparison between of two or more five-number summaries.
The five number summary is a set of statistics:
The summaries for each data set are both plotted on the same graph for easier comparison. The comparisons can be parallel (stacked on top of each other) or side-by-side, in which case they are sometimes called side-by-side boxplots. There’s no “right” way of presenting this information: use the orientation that makes sense for your data.
What are parallel boxplots used for?
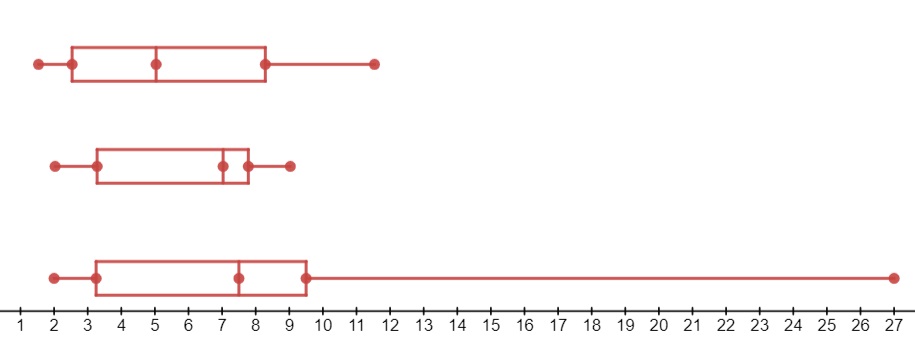
A parallel boxplot is ideal for comparing multiple samples — something that isn’t easy to do with histograms or other graphs. For example, the bottom boxplot on this parallel histogram has more variability (a larger range) than the other two data sets:
- The box length indicates the spread of data, or sample variability.
- The line across the box shows the median, or center. When use with the position of the box in the whiskers, the line can also indicate whether the sample is skewed or symmetric.
Disadvantages
One disadvantage of parallel boxplots is that the five number summary is just a bird’s eye view of data, so the chart lacks the precision of some other charts. For example, although histograms are difficult to compare, they can contain more information such as classes or categories work well on large data sets that are too disorderly to be displayed using other plots. Both histograms and any type of boxplot obscure details though, such as the type of probability distribution that the data might fit. It is for this reason that boxplots usually aren’t recommended for trying to gauge the fit of data to a certain distribution.
If skewness is an important consideration, parallel boxplots might not be the best choice.
In addition, if the distribution is bimodal (with two peaks) or multimodal (more than two peaks), a boxplot will only return one “box” for all peaks, which can be misleading.