< List of probability distributions < Hypergeometric Distribution
Contents:
What is the Hypergeometric Distribution?
The hypergeometric distribution is a discrete probability distribution that calculates the probability an event happens k times in n trials when sampling from a small population without replacement. In other words, it describes the probability of getting a certain number of “successes” in a sample of a given size, drawn from a population of a known size, without putting any of the “successes” back into the population.
The hypergeometric distribution is very similar to the binomial distribution. In fact, the binomial distribution is a very good approximation of the hypergeometric distribution as long as you are sampling 5% or less of the population. Therefore, in order to understand the hypergeometric distribution, you should be familiar with the binomial distribution. Plus, you should be comfortable with using the combinations formula. 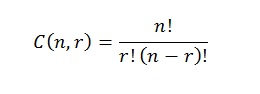
Hypergeometric Distribution Formula
The (somewhat formal) definition for the hypergeometric distribution, where X is a random variable, is: 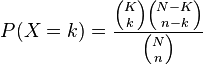 Where:
- K is the number of successes in the population,
- k is the number of observed successes,
- N is the population size,
- n is the number of draws.
Hypergeometric Distribution Example 1
A deck of cards contains 20 cards: 6 red cards and 14 black cards. 5 cards are drawn randomly without replacement. What is the probability that exactly 4 red cards are drawn? The probability of choosing exactly 4 red cards is: P(4 red cards) = # samples with 4 red cards and 1 black card / # of possible 4 card samples.
Using the combinations formula, the problem becomes: 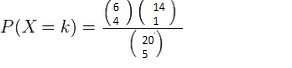 In shorthand, the above formula can be written as:
(6C4*14C1)/20C5
where
- 6C4 means that out of 6 possible red cards, we are choosing 4.
- 14C1 means that out of a possible 14 black cards, we’re choosing 1.
Solution = (6C4*14C1)/20C5 = 15*14/15504 = 0.0135 The binomial distribution doesn’t apply here, because the cards are not replaced once they are drawn. In other words, the trials are not independent events. For example, for 1 red card, the probability is 6/20 on the first draw. If that card is red, the probability of choosing another red card falls to 5/19.
Hypergeometric Distribution Example 2
A small voting district has 101 female voters and 95 male voters. A random sample of 10 voters is drawn. What is the probability exactly 7 of the voters will be female? Solution: 101C7*95C3/(196C10)= (17199613200*138415)/18257282924056176 = 0.130 Where:
- 101C7 is the number of ways of choosing 7 females from 101 and
- 95C3 is the number of ways of choosing 3 male voters* from 95
- 196C10 is the total voters (196) of which we are choosing 10.
*That’s because if 7/10 voters are female, then 3/10 voters must be male. Check out our YouTube channel for hundreds of statistics help videos!
Application of Hypergeometric Distribution in Real Life: Examples
The hypergeometric distribution describes the number of successes in a sequence of n trials from a finite population without replacement. At first glance, it might seem that this is a purely academic distribution, but there are actually many different applications of the hypergeometric distribution in real life. 
One of the most common applications of the hypergeometric distribution is in industrial quality control, such as calculating probabilities for defective parts produced in a factory. Let’s say a factory line produces 1% defective parts that are boxed at the end of the line; The hypergeometric distribution can be used to model the occurrence of defective parts for quality control purposes, as long as the items being sampled from a box are not replaced.
In electrochemistry, the hypergeometric distribution can predict the effect of surface deterioration on electrode behavior for any electrode process with two competing reactions. This gives valuable information about the effectiveness of electrode-electrolyte interfaces and improves interpretation of the measurements of surface properties [1].
If you play poker, the hypergeometric distribution can tell you the probability of getting 3 of the same suit in a 5 card hand (or any number of other card/hand combinations).
The PowerBall lottery game is a televised, two part drawing. In the first stage, five white balls are drawn randomly from a bowl of 49 balls. In the second stage, one red ball (the PowerBall) is drawn randomly from a bowl of 42 balls. The probability of success changes from one draw to the next (the balls are not replaced), so the probabilities for the game can be modeled with the hypergeometric distribution [2].
Binomial vs. hypergeometric distribution
The hypergeometric distribution is very similar to the binomial distribution. In fact, the binomial distribution is a good approximation of the hypergeometric distribution if you are sampling 5% or less of the population.
A key difference between the hypergeometric distribution and the binomial distribution is that the former is a discrete probability distribution, while the latter is a continuous probability distribution. This means that the hypergeometric distribution deals with situations where the number of possible outcomes is finite and countable, while the binomial distribution deals with situations where the number of possible outcomes is infinite and uncountable. For example, if you roll a die 10 times, the number of possible outcomes is finite and countable (1, 2, 3, 4, 5, or 6), so we would use the hypergeometric distribution to determine the probability of getting a specific number of 6’s. On the other hand, if you measure the length of a piece of wire to 10 decimal places, the number of possible outcomes is infinite and uncountable, so we would use the binomial distribution to model the probability of getting a certain range of values.
In addition to its applications in sampling without replacement, the hypergeometric distribution has other important applications in various fields such as genetics, ecology, and epidemiology. For example, it can be used to calculate the probability of getting a certain number of disease cases in a population of a given size, without assuming that the number of cases follows a normal distribution.
One important point to note is that the hypergeometric distribution assumes that the population size is much larger than the sample size. In other words, the proportion of “successes” in the population doesn’t change significantly after each draw. If the sample size is large relative to the population size, then the hypergeometric distribution is not an appropriate model and we should use the binomial distribution instead.
In conclusion, probability distributions are powerful tools for analyzing and interpreting data in various fields. While the binomial distribution is widely known and used, it’s important to understand that there are other probability distributions that are just as essential. The hypergeometric distribution is one such distribution, which is used to model situations where we are sampling without replacement. By understanding the key differences between the hypergeometric and binomial distributions, we can choose the appropriate distribution for our analysis and avoid common mistakes.
References
- Fahidy, T. (2012). An application of hypergeometric distribution theory to competitive processes at deteriorating electrode surfaces. In Electrochemistry Communications, 282-284
- Anderson, J. & Schmidt, J. (2002). Playing Powerball?. Proceedings. Annual Conference on Taxation and Minutes of the Annual Meeting of the National Tax Association. pp. 377-382.