Probability Distribution: List of Statistical Distributions > Hansmann’s distributions
What are Hansmann’s distributions?
Hansmann’s distributions [1] are a Pearson type symmetric family obtained from a generalized Pearson differential equation [2]. These distributions are symmetric about zero and flexible in shape; Hansmann gave explicit solutions for seven different forms.
Outside of a mention in the usual indices of probability distributions such as Johnson, Kotz, and Balakrishnan’s seminal work on continuous probability distributions [3], there are no recent mentions of the distribution in the literature, despite Hansmann’s original article being considered “important” in Deming’s 1962 publication Selected Bibliography of Statistical Literature 1930 to 1957 [4]. The fact that these distributions are seldom used today is perhaps because of errors in Hansmann’s original equations — later corrected by Pawula & Rice [5], but perhaps not forgiven.
Deriving Hansmann’s Distributions
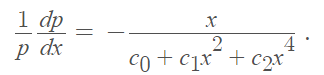
Hansmann’s distributions are derived from Pearson’s equation
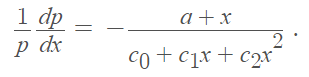
Which becomes
The probability density functions (which Johnson et al [3] notes contain a correction by Pawula & Rice [5]) are:
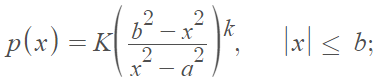
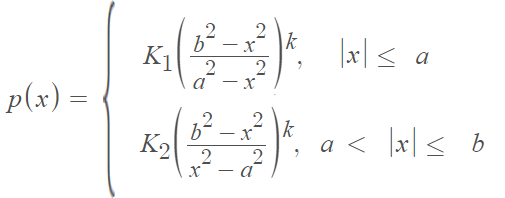
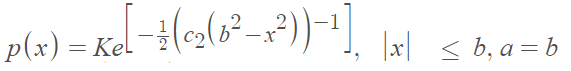
Where
- K= ½ {c2(b2 – a2)}-1
- K, K1, K2 = normalizing constants.
K1 and K2 must satisfy the conditions
- ∫P(x)dx = 1
- ∫x2p(x)= σ2x.
Where ∫ is an integral (from calculus), a.k.a. the area under the curve.
References
- Hansmann, G. H. (1934). On certain non-normal symmetric frequency distributions, Biometrika, 26, 129-135
- Haight, F. (1958). Index to the Distributions of Mathematical Statistics. National Bureau of Standards Report.
- Johnson, Kotz, and Balakrishnan, (1994), Continuous Univariate Distributions, Volumes I and II, 2nd. Ed., John Wiley and Sons.
- Deming, L. (1961). Selected Bibliography of Statistical Literature 1930 to 1957: V. Frequency Functions, Moments, and Graduation. JOURNAL OF RESEARCH of the National Bureau of Standards-B. Mathematics and Mathematical Physics Vol. 66B, No.1, January-March 1962
- Pawula, R. F., and Rice, S. 0. (1989). A note on Hansmann’s 1934 family of distributions, IEEE Transactions on Information Theory, 35, 910-91 1.