The GARCH model, or Generalized Autoregressive Conditionally Heteroscedastic model, was developed by doctoral student Tim Bollerslev in 1986. The goal of GARCH is to provide volatility measures for heteoscedastic time series data, much in the same way standard deviations are interpreted in simpler models.
The simplest GARCH model is the ARCH(1) model, which bears many similarities with AR(1) models. More complex ARCH(p) models are analogous to AR(p) models. Finally, Generalized ARCH models represent conditional variances in the same way that ARMA models handle conditional expectation.
Uses
GARCH models have various applications for the analysis of time series data in finance and economics. They are especially useful when there are periods of fast changing variation (or volatility). For example, they can efficiently model volatility of financial assets prices such as bonds, market indices, and stocks (Francq & Zakoian, 2011).
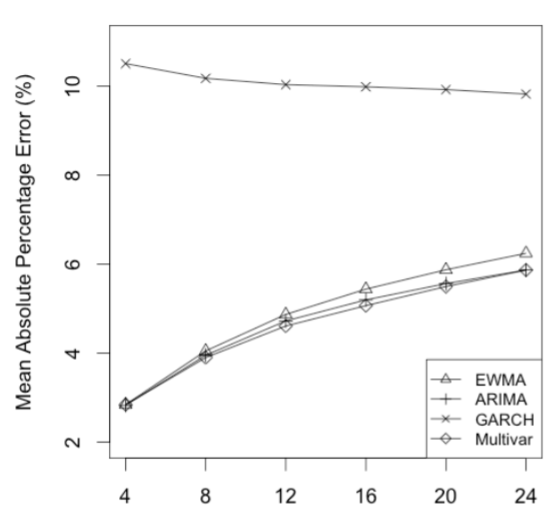
The utility of a GARCH model isn’t limited to financial applications. For example, Kim et al. (2014) used a GARCH model in their comparative study of different time series forecasting methods to predict patient volumes in hospitals.
Heteroscedasticity and the GARCH model
Heteroscedasticity refers to the irregular variations of error terms seen in a time series model. Observations tend to cluster, rather than following the neat line seen in linear modeling. This makes analysis of heteroscedastic data challenging.
In your conventional least squares model, the presence of heteroscedasticity can lead to too-narrow standard errors and confidence intervals, giving a false sense of precision. GARCH models address this by treating heteroscedasticity as a variance which can be modeled. Predictions are then computed for each error term’s variance (Engle, 2001).
Basic Steps
A GARCH model follows three basic steps:
- Estimate the best fit autoregressive model.
- Calculate autocorrelations of the error term,
- Test for statistical significance.
These steps involved (for example, finding maximum likelihood estimates of the conditionally normal model) and are usually performed with software. For example, the GARCH function in R.
References
Engle, R. (2001). GARCH 101: An Introduction to the Use of ARCH/GARCH models in Applied Econometrics. Retrieved May 11, 2020 from: https://www.stern.nyu.edu/rengle/GARCH101.PDF
Francq, C. & Zakoian, J. (2011). GARCH Models Structure, Statistical Inference and Financial Applications. Wiley.
GARCH models. Retrieved May 11, 2020 from: https://faculty.washington.edu/ezivot/econ589/ch18-garch.pdf
Kim et al. (2014). Predicting Patient Volumes in Hospital Medicine: A Comparative Study of Different Time Series Forecasting Methods. Retrieved May 11, 2020 from: https://www.mcs.anl.gov/~kibaekkim/ForecastingHospitalMedicine.pdf