How to find a five-number summary in statistics
Contents:
- Find a Five-Number Summary by Hand
- TI 89 Instructions
- SPSS Instructions
- 5 number summary in Excel (new window)
How to find a five-number summary in statistics: Overview
Watch the video for an example of how to find a 5 number summary for an odd set of numbers:

The five number summary includes 5 items:
- The minimum.
- Q1 (the first quartile, or the 25% mark).
- The median.
- Q3 (the third quartile, or the 75% mark).
- The maximum.
The five number summary gives you a rough idea about what your data set looks like. for example, you’ll have your lowest value (the minimum) and the highest value (the maximum). Although it’s useful in itself, the main reason you’ll want to find a five-number summary is to find more useful statistics, like the interquartile range, sometimes called the middle fifty.
Need help? Check out our tutoring page!
How to Find a Five-Number Summary: Steps
- Step 1: Put your numbers in ascending order (from smallest to largest). For this particular data set, the order is:
Example: 1, 2, 5, 6, 7, 9, 12, 15, 18, 19, 27. - Step 2: Find the minimum and maximum for your data set. Now that your numbers are in order, this should be easy to spot.
In the example in step 1, the minimum (the smallest number) is 1 and the maximum (the largest number) is 27. - Step 3: Find the median. The median is the middle number. If you aren’t sure how to find the median, see: How to find the mean mode and median.
- Step 4: Place parentheses around the numbers above and below the median.
(This is not technically necessary, but it makes Q1 and Q3 easier to find).
(1, 2, 5, 6, 7), 9, (12, 15, 18, 19, 27). - Step 5: Find Q1 and Q3. Q1 can be thought of as a median in the lower half of the data, and Q3 can be thought of as a median for the upper half of data.
(1, 2, 5, 6, 7), 9, ( 12, 15,18,19,27). - Step 6: Write down your summary found in the above steps.
minimum = 1, Q1 = 5, median = 9, Q3 = 18, and maximum = 27.
That’s it!
When the Summary doesn’t exist
Sometimes, it’s impossible to find a five-number summary. In order for the five numbers to exist, your data set must meet these two requirements:
- Your data must be univariate. In other words, the data must be a single variable. For example, this list of weights is one variable: 120, 100, 130, 145. If you have a list of ages and you want to compare the ages to weights, it becomes bivariate data (two variables). For example: age 1 (25 pounds), 5 (60 pounds), 15 (129 pounds). The matching pairs makes it impossible to find a five number summary.
- Your data must be ordinal, interval, or ratio.
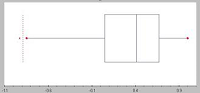
Box and whisker chart
A box and whiskers chart is a visual representation of the summary.
Box Plot / Find a Five-Number Summary on the TI 89
When you create a box and whiskers chart on the TI-89, the TI-89 will automatically calculate the five number summary for you.
Example problem: Create a box and whiskers chart and find the five number summary for the following data: 200, 350, 300, 350, and 400.
Step 1: Create a new folder called “Box.” From the HOME screen, press F4 and scroll down to NewFold (option B). Press ENTER.
Step 2: Press 2nd Alpha ( – x to spell B O X and press ENTER.
Step 3: Press APPS, then scroll down to Stats/List Editor. Press ENTER twice.
Step 4: Press the down arrow key to get to the first line of the list. Enter your data into list1. Follow each entry with a comma: 200, 350, 300, 350, 400.
Step 5: Press F2 then 1 to enter Plot Setup.
Step 6: Press F1, right arrow, and 5 to select mod box plot.
Step 7: Arrow down to Mark and select box.
Step 8: Arrow down and enter B O X (using the alphanumeric keypad) in the x. Press ENTER.
Step 9: Read the boxplot. Press F3 and use the left and right cursors to find Min(200), Q1(250), Med(325), Q3(400), and Max(500).
That’s it!
Tip: if you want to change the folder back to MAIN, press MODES, scroll down to Current Folder. Press right key, then press 1 ENTER.
TipIf you get the error message undefined variable, it can be a frustrating process to try and solve the problem. Clearing the memory *may* help, but an easier way to get the box plot to graph is to enter the data into “list 1” in the List Editor and then type “list 1” as your “x” when defining the box plot.
Lost your guidebook? You can download a new one from the TI website here.
Back to Top
Find a Five Number Summary in SPSS
Calculating the five number summary is pretty straightforward if you have a small data set, but for larger data sets — which you will typically work with in SPSS — the task can be impossibly tedious. That’s where software like SPSS comes in handy — tasks that would sometimes take hours by hand can be calculated in a fraction of a second. The SPSS five number summary is calculated with the “Frequencies” tool.
Watch the video for the steps:
Step 1: Open a new data sheet and type your data into a column (or several columns). To open a new data sheet, click “File” in the toolbar, then click “new” and then click “Data.” Make sure you type your data without spaces (in other words, don’t leave empty rows).
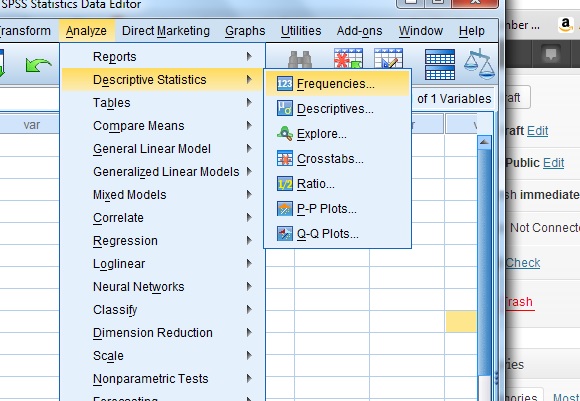
Step 2: Click “Analyze,” then click “Descriptive Statistics” and then click “Frequencies” to open the Frequencies dialog box.
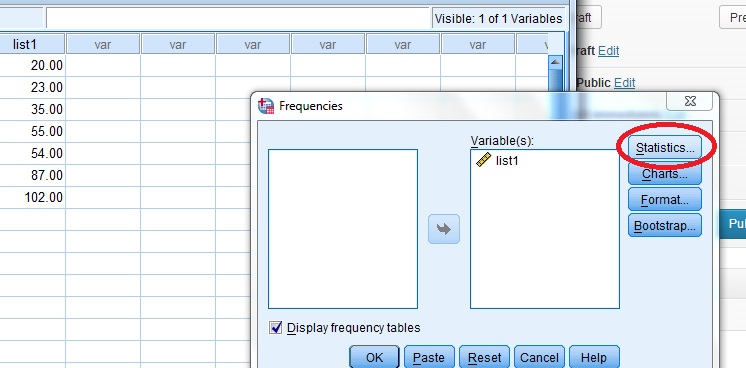
Step 3: Click a variable name (or several if you have entered your data into multiple columns) and then click the central arrow to move them to the Variable(s) list box. Note that SPSS uses the term “Variables,” but all it really means is the column header name. You can change this name by clicking the “Variables” view button at the bottom of the sheet.
Step 4: Click “Statistics” to open the Statistics dialog box.
Step 5: Check “Quartiles,” “median,” “minimum” and “maximum” and then click “Continue.”
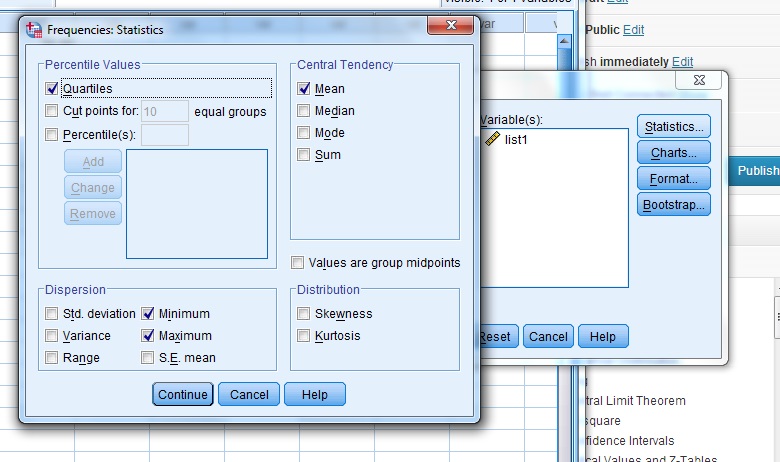
Step 6: Click “OK”. The SPSS five number summary is calculated and the results are returned in a new window.
Note: SPSS lists the first quartile (Q1) as the 25th percentile in the results window, and the third quartile (Q3) is listed as the 75th percentile.
Back to Top
Check out our YouTube channel for more stats help and tips.
References
Larry Gonick. The Cartoon Guide to Statistics, 1993
David C. Hoaglin, Frederick Mosteller and John W. Tukey. “Understanding robust and exploratory data analysis“. Wiley, 1983.