Bimodal Distribution: Two Peaks.
Data distributions in statistics can have one peak, or they can have several peaks. The type of distribution you might be familiar with seeing is the normal distribution, or bell curve, which has one peak. The bimodal distribution has two peaks.
Watch the video for an overview of the bimodal distribution:
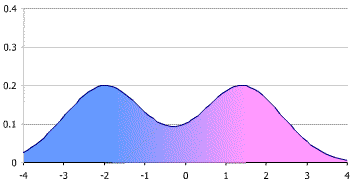
The “bi” in bimodal distribution refers to “two” and modal refers to the peaks. It can seem a little confusing because in statistics, the term “mode” refers to the most common number. However, if you think about it, the peaks in any distribution are the most common number(s). The two peaks in a bimodal distribution also represent two local maximums; these are points where the data points stop increasing and start decreasing.
Q. What does a Bimodal Distribution tell you?
You’ve got two peaks of data, which usually indicates you’ve got two different groups. For example, exam scores tend to be normally distributed with a single peak. However, grades sometimes fall into a bimodal distribution with a lot of students getting A grades and a lot getting F grades. This can tell you that you are looking at two different groups of students. It could be that one group is underprepared for the class (perhaps because of a lack of previous classes). The other group may have overprepared.
Two peaks could also indicate your data is sinusoidal. If you suspect your data might be following a wave-like pattern, create a scatter plot or a run sequence plot to double-check for sinusoidal patterns. You could also make a lag plot; an elliptical pattern would confirm that the data is sinusoidal.
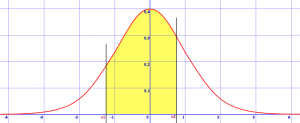
Sometimes, what appears to be a bimodal distribution is actually two unimodal (one-peaked) distributions graphed on the same axis. For example, this image shows a bimodal distribution for a group of students who did not study (the left peak) and a group of students who did study (on the right).

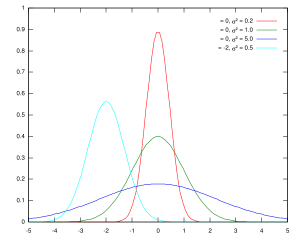
Unimodal Distributions.
Unimodal distributions have a single peak, or mode.
Multimodal Distributions
Multimidal distributions have more than two peaks. If you can’t clearly find one peak or two peaks in a graph, the likelihood is that you either have a uniform distribution (where all the peaks are the same height) or a multimodal distribution, where there are several peaks of the same height.
Tip: Although you might commonly associate “mode” with being the most frequently occurring number in a data set, the term mode actually has two meanings in statistics, which can be confusing: it can either be a local maximum in a chart, or it can be the most frequently occurring score in a chart. The “mode” in bimodal distribution means a local maximum in a chart (i.e. a local mode). The two terms actually mean the same thing, as the most commonly found item in a data set will have a peak. But when you’re trying to categorize graphs, it’s easier to think of the mode as a “peak” rather than a common number. This helps especially if the axes are not labeled.
Fun fact: While the bell curve is normally associated with grades (i.e. 5% of the class will get an A and 10% of the class will get a B), it’s also quite normal to have a bimodal distribution where roughly half of a class will do very well (getting As and Bs) and the other half of the class will receive poor grades (Ds and Fs). Bimodal distributions are very common in college freshman mathematics classes!
References
Gonick, L. (1993). The Cartoon Guide to Statistics. HarperPerennial.
Kotz, S.; et al., eds. (2006), Encyclopedia of Statistical Sciences, Wiley.
Everitt, B. S.; Skrondal, A. (2010), The Cambridge Dictionary of Statistics, Cambridge University Press.