Clustering > Hierarchical Clustering
What is Hierarchical Clustering?
Hierarchical clustering is where you build a cluster tree (a dendrogram) to represent data, where each group (or “node”) links to two or more successor groups. The groups are nested and organized as a tree, which ideally ends up as a meaningful classification scheme.
Each node in the cluster tree contains a group of similar data; Nodes group on the graph next to other, similar nodes. Clusters at one level join with clusters in the next level up, using a degree of similarity; The process carries on until all nodes are in the tree, which gives a visual snapshot of the data contained in the whole set. The total number of clusters is not predetermined before you start the tree creation.
What is a Dendrogram?
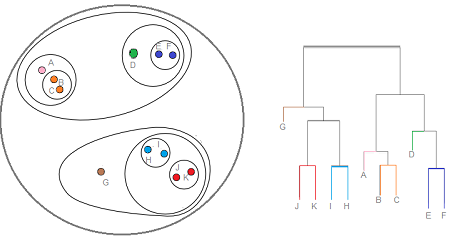
A dendrogram is a type of tree diagram showing hierarchical clustering — relationships between similar sets of data. They are frequently used in biology to show clustering between genes or samples, but they can represent any type of grouped data.
Parts of a Dendrogram
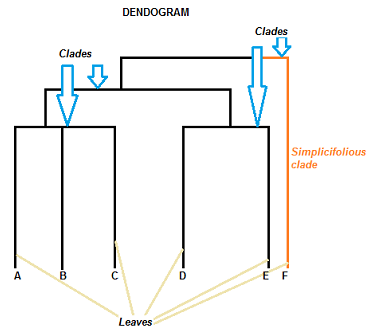
A dendrogram can be a column graph (as in the image below) or a row graph. Some dendograms are circular or have a fluid-shape, but software will usually produce a row or column graph. No matter what the shape, the basic graph comprises of the same parts:
- The clade is the branch. Usually labeled with Greek letters from left to right (e.g. α β, δ…).
- Each clade has one or more leaves. The leaves in the above image are:
- Single (simplicifolius): F
- Double (bifolius): D E
- Triple (trifolious): A B C
A clade can theoretically have an infinite amount of leaves. However, the more leaves you have, the harder the graph will be to read with the naked eye.
How to Read a Dendrogram
The clades are arranged according to how similar (or dissimilar) they are. Clades that are close to the same height are similar to each other; clades with different heights are dissimilar — the greater the difference in height, the more dissimilarity (you can measure similarity in many different ways; One of the most popular measures is Pearson’s Correlation Coefficient).
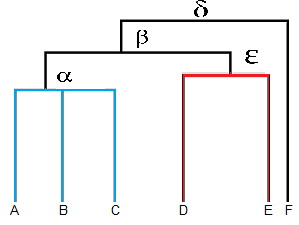
- Leaves A, B, and C are more similar to each other than they are to leaves D, E, or F.
- Leaves D and E are more similar to each other than they are to leaves A, B, C, or F.
- Leaf F is substantially different from all of the other leaves.
Note that on the above graph, the same clave, β joins leaves A, B, C, D,and E. That means that the two groups (A,B,C & D,E) are more similar to each other than they are to F.
Hierarchical Clustering Algorithms
All hierarchical clustering algorithms are monotonic — they either increase or decrease. The algorithms can be bottom up or top down:
1. Bottom up (Hierarchical Agglomerative Clustering, HAC):
- Treat each document as a single cluster at the beginning of the algorithm.
- Merged(agglomerate) two items at a time into a new cluster. How the pairs merge involves calculating a dissimilarity between each merged pair and the other samples. There are many ways to do this. Popular options:
- Complete linkage: similarity of the farthest pair. One drawback is that outliers can cause merging of close groups later than is optimal.
- Single-linkage: similarity of the closest pair. This can cause premature merging of groups with close pairs, even if those groups are quite dissimilar overall.
- Group average: similarity between groups.
- Centroid similarity: each iteration merges the clusters with the most similar central point.
- The pairing process continues until all items merge into a single cluster.
HAC’s account for the vast majority of hierarchical clustering algorithms. However, one downside is that they have significant computational and storage requirements — especially for big data. These complex algorithms are about quadruple the size of the K-means algorithm. Also, merging can’t be reversed, which can create a problem if you have noisy, high-dimensional data.
2. Top down (Divisive Clustering):
- Data starts as one combined cluster.
- The cluster splits into two distinct parts, according to some degree of similarity.
- Clusters split into two again and again until the clusters only contain a single data point.
Divisive clustering is very rarely used.
Downsides
Hierarchical clustering can easily lead to dendrograms that are just plain wrong. Unless you known your data inside out (pretty much impossible for big data sets), this is largely unavoidable. One of the main reasons for this is that the clustering algorithm will work even on the most unsuitable data. Another reason is that the decision you make for creating clusters (Step 2 above) can lead to significantly different dendrograms. The choice can be tough to make in advance, and you may not be able to tell which of the four end results are the most suitable.
Real Life Example
The fact that the hierarchical clustering algorithm will work even if presented with seemingly unrelated data can be a positive as well as a negative. For example, a 2003 research team used hierarchical clustering to “support the idea that many…breast tumor subtypes represent biologically distinct disease entities.” To the human eye, the original data looked like noise, but the algorithm was able to find patterns.